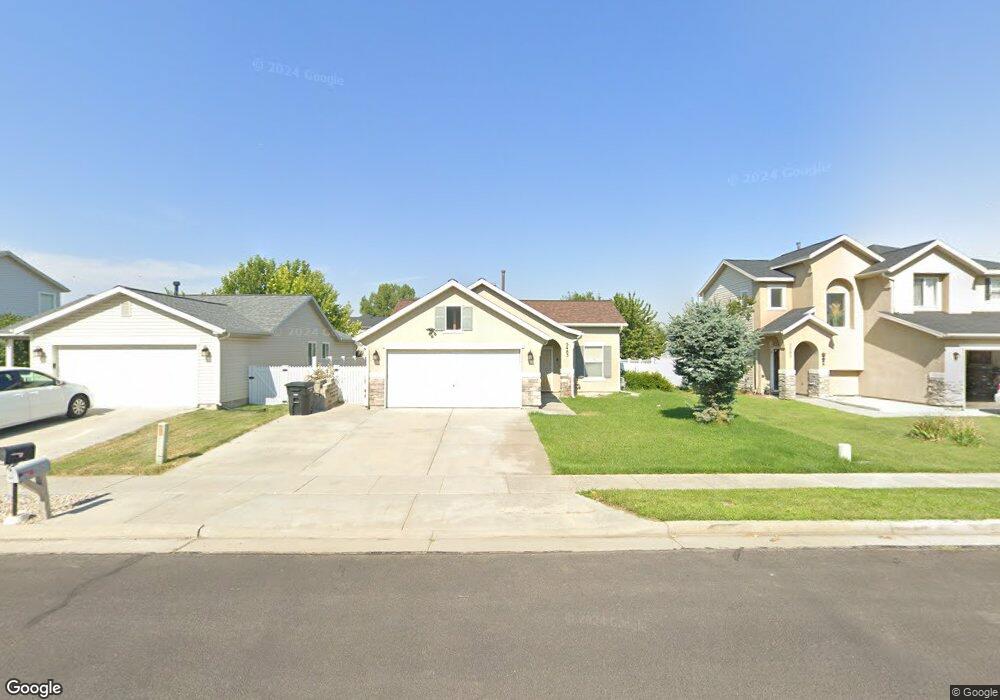
5483 Scarsborough Way Tooele, UT 84074
Estimated Value: $379,000 - $408,935
3
Beds
1
Bath
1,070
Sq Ft
$367/Sq Ft
Est. Value
About This Home
This home is located at 5483 Scarsborough Way, Tooele, UT 84074 and is currently estimated at $392,984, approximately $367 per square foot. 5483 Scarsborough Way is a home located in Tooele County with nearby schools including Rose Springs Elementary School, Clarke N. Johnsen Junior High School, and Stansbury High School.
Ownership History
Date
Name
Owned For
Owner Type
Purchase Details
Closed on
Nov 21, 2011
Sold by
Zander Ross
Bought by
Zander Ross and Bicer Elif
Current Estimated Value
Purchase Details
Closed on
Mar 29, 2011
Sold by
Us Bank Na
Bought by
The Secretery Of Hud
Purchase Details
Closed on
Mar 21, 2011
Sold by
Allsman Dereck and Rich Alysha
Bought by
Us Bank Na
Purchase Details
Closed on
Feb 17, 2009
Sold by
Johnson Lester M and Johnson Mildred R
Bought by
Allsman Dereck and Rich Alysha
Home Financials for this Owner
Home Financials are based on the most recent Mortgage that was taken out on this home.
Original Mortgage
$156,120
Interest Rate
4.92%
Mortgage Type
FHA
Create a Home Valuation Report for This Property
The Home Valuation Report is an in-depth analysis detailing your home's value as well as a comparison with similar homes in the area
Home Values in the Area
Average Home Value in this Area
Purchase History
| Date | Buyer | Sale Price | Title Company |
|---|---|---|---|
| Zander Ross | -- | Monument Title Insurance Inc | |
| The Secretery Of Hud | -- | None Available | |
| Us Bank Na | $167,039 | None Available | |
| Allsman Dereck | -- | Security Title Ins Agen |
Source: Public Records
Mortgage History
| Date | Status | Borrower | Loan Amount |
|---|---|---|---|
| Previous Owner | Allsman Dereck | $156,120 |
Source: Public Records
Tax History Compared to Growth
Tax History
| Year | Tax Paid | Tax Assessment Tax Assessment Total Assessment is a certain percentage of the fair market value that is determined by local assessors to be the total taxable value of land and additions on the property. | Land | Improvement |
|---|---|---|---|---|
| 2025 | $3,028 | $382,709 | $128,000 | $254,709 |
| 2024 | $3,280 | $210,717 | $70,400 | $140,317 |
| 2023 | $3,280 | $186,144 | $76,450 | $109,694 |
| 2022 | $2,113 | $169,537 | $60,940 | $108,597 |
| 2021 | $1,977 | $131,072 | $54,065 | $77,007 |
| 2020 | $1,850 | $214,390 | $74,200 | $140,190 |
| 2019 | $1,800 | $205,187 | $74,200 | $130,987 |
| 2018 | $1,483 | $161,954 | $40,000 | $121,954 |
| 2017 | $1,352 | $156,147 | $40,000 | $116,147 |
| 2016 | $1,186 | $77,548 | $22,000 | $55,548 |
| 2015 | $1,186 | $74,404 | $0 | $0 |
| 2014 | -- | $74,404 | $0 | $0 |
Source: Public Records
Map
Nearby Homes
- 5454 Heather Way
- 39 Strasbourg Ln
- 5419 Heather Way
- 5502 Ardennes Way
- 5546 Ardennes Way
- 45 W Streams Edge Way
- 198 Clermont Ln
- 5584 N Gentle Breeze Ct
- 107 Pebble Beach Dr
- 5493 Lorraine Way
- 133 W Marigold Cir Unit 311
- 5531 Ponderosa Ln
- 5675 Lanyard Ln
- 5581 Brienne Way
- 62 Fairway Dr
- 5718 Lanyard Ln
- 5246 Roma Ln
- 5634 Miller Cir
- 138 W Morning Glory Cir
- 5229 N Ventura Cir
- 5489 Scarsborough Way
- 5475 Scarsborough Way
- 5467 Scarsborough Way
- 5497 Scarsborough Way
- 5484 Heather Way
- 5490 Heather Way
- 5461 Scarsborough Way
- 5498 Heather Way
- 5482 Scarsborough Way
- 5476 Heather Way
- 5472 Scarsborough Way
- 5490 Scarsborough Way
- 5468 Heather Way
- 5462 Heather Way
- 5453 Scarsborough Way
- 5464 Scarsborough Way
- 5456 Scarsborough Way
- 5456 Scarsborough Way Unit 243
- 5445 Scarsborough Way
- 69 Strasbourg Ln