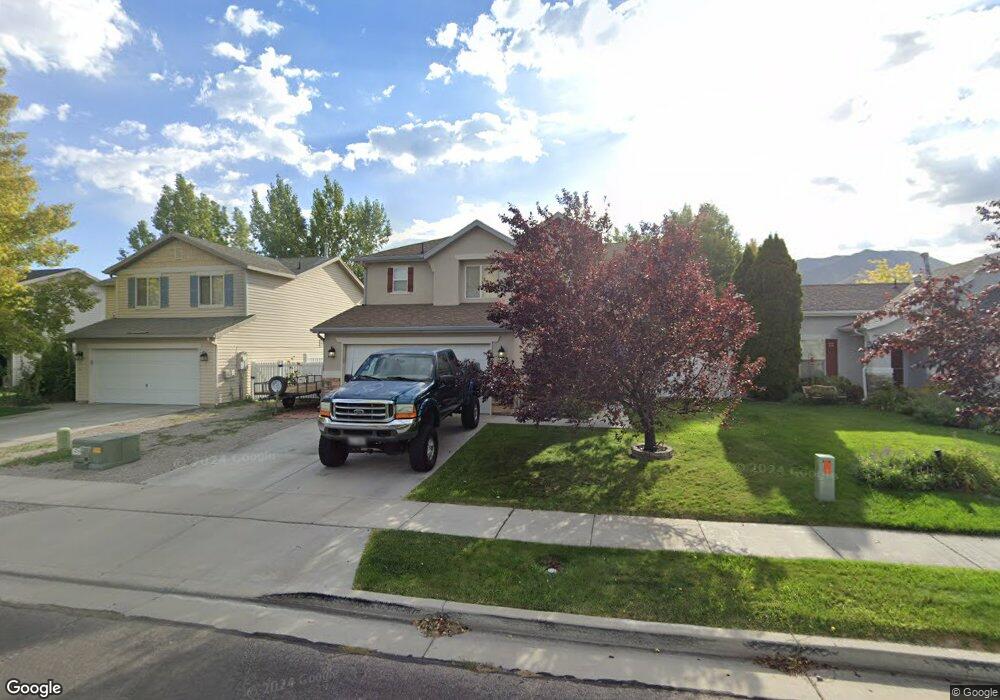
5486 Ardennes Way Tooele, UT 84074
Estimated Value: $408,000 - $432,000
3
Beds
3
Baths
1,394
Sq Ft
$303/Sq Ft
Est. Value
About This Home
This home is located at 5486 Ardennes Way, Tooele, UT 84074 and is currently estimated at $422,078, approximately $302 per square foot. 5486 Ardennes Way is a home located in Tooele County with nearby schools including Rose Springs Elementary School, Clarke N. Johnsen Junior High School, and Stansbury High School.
Ownership History
Date
Name
Owned For
Owner Type
Purchase Details
Closed on
Jun 13, 2017
Sold by
Powell Katie
Bought by
Tharp Shawn
Current Estimated Value
Home Financials for this Owner
Home Financials are based on the most recent Mortgage that was taken out on this home.
Original Mortgage
$219,696
Outstanding Balance
$182,791
Interest Rate
4.03%
Mortgage Type
New Conventional
Estimated Equity
$239,287
Purchase Details
Closed on
Jun 10, 2014
Sold by
Atkission William R and Atkission Mandy L
Bought by
Powell Katie
Purchase Details
Closed on
Nov 30, 2005
Sold by
Winn John and Winn Holly
Bought by
Atkission William B and Atkission Mandy L
Home Financials for this Owner
Home Financials are based on the most recent Mortgage that was taken out on this home.
Original Mortgage
$110,020
Interest Rate
6.07%
Mortgage Type
New Conventional
Create a Home Valuation Report for This Property
The Home Valuation Report is an in-depth analysis detailing your home's value as well as a comparison with similar homes in the area
Home Values in the Area
Average Home Value in this Area
Purchase History
| Date | Buyer | Sale Price | Title Company |
|---|---|---|---|
| Tharp Shawn | -- | Monument Title Insurance Co | |
| Powell Katie | -- | Title Guarantee | |
| Atkission William B | -- | Us Title Utah |
Source: Public Records
Mortgage History
| Date | Status | Borrower | Loan Amount |
|---|---|---|---|
| Open | Tharp Shawn | $219,696 | |
| Previous Owner | Atkission William B | $110,020 |
Source: Public Records
Tax History Compared to Growth
Tax History
| Year | Tax Paid | Tax Assessment Tax Assessment Total Assessment is a certain percentage of the fair market value that is determined by local assessors to be the total taxable value of land and additions on the property. | Land | Improvement |
|---|---|---|---|---|
| 2025 | $3,209 | $405,541 | $128,000 | $277,541 |
| 2024 | $3,479 | $223,529 | $70,400 | $153,129 |
| 2023 | $3,479 | $196,512 | $76,450 | $120,062 |
| 2022 | $2,330 | $187,021 | $60,940 | $126,081 |
| 2021 | $2,191 | $145,219 | $54,065 | $91,154 |
| 2020 | $2,072 | $240,185 | $74,200 | $165,985 |
| 2019 | $2,100 | $217,581 | $74,200 | $143,381 |
| 2018 | $1,607 | $175,543 | $40,000 | $135,543 |
| 2017 | $1,464 | $169,089 | $40,000 | $129,089 |
| 2016 | $1,279 | $83,738 | $22,000 | $61,738 |
| 2015 | $1,279 | $80,243 | $0 | $0 |
| 2014 | -- | $80,243 | $0 | $0 |
Source: Public Records
Map
Nearby Homes
- 5502 Ardennes Way
- 5546 Ardennes Way
- 198 Clermont Ln
- 39 Strasbourg Ln
- 5454 Heather Way
- 5493 Lorraine Way
- 5419 Heather Way
- 107 Pebble Beach Dr
- 45 W Streams Edge Way
- 5584 N Gentle Breeze Ct
- 5581 Brienne Way
- 5634 Miller Cir
- 133 W Marigold Cir Unit 311
- 62 Fairway Dr
- 5489 Hampton Way
- 5675 Lanyard Ln
- 5531 Ponderosa Ln
- 5718 Lanyard Ln
- 5229 N Ventura Cir
- 789 Country Club Dr
- 5494 Ardennes Way
- 5480 Ardennes Way
- 5487 Geneva Way
- 5510 Ardennes Way
- 5495 Geneva Way
- 5477 Geneva Way
- 5491 Ardennes Way
- 5483 Ardennes Way
- 5464 Ardennes Way
- 5499 Ardennes Way
- 5469 Geneva Way
- 5475 Ardennes Way
- 5516 Ardennes Way
- 5465 Ardennes Way
- 5456 Ardennes Way
- 5513 Geneva Way
- 5465 Ardennes Way
- 5524 Ardennes Way
- 5459 Geneva Way
- 115 Strasbourg Ln