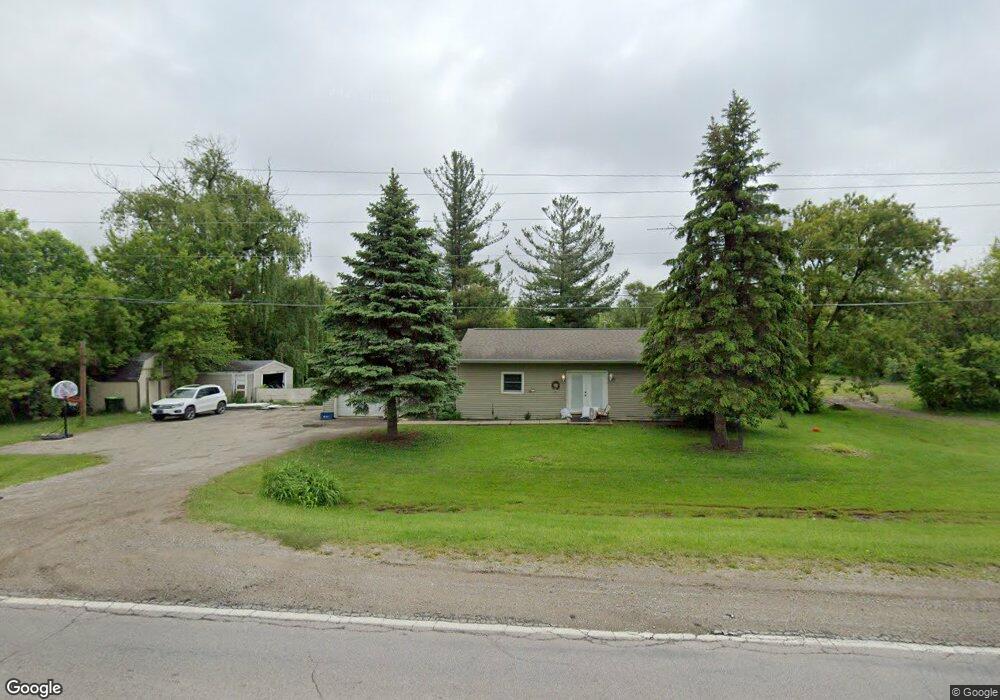
5486 N Elms Rd Flushing, MI 48433
Estimated Value: $174,000 - $190,000
3
Beds
1
Bath
1,052
Sq Ft
$171/Sq Ft
Est. Value
About This Home
This home is located at 5486 N Elms Rd, Flushing, MI 48433 and is currently estimated at $180,190, approximately $171 per square foot. 5486 N Elms Rd is a home located in Genesee County with nearby schools including Springview Elementary School, Flushing Middle School, and Flushing High School.
Ownership History
Date
Name
Owned For
Owner Type
Purchase Details
Closed on
Apr 5, 2023
Sold by
Simpson Robert J and Simpson Georgia A
Bought by
Sleder Amanda
Current Estimated Value
Home Financials for this Owner
Home Financials are based on the most recent Mortgage that was taken out on this home.
Original Mortgage
$100,122
Outstanding Balance
$97,365
Interest Rate
6.65%
Mortgage Type
FHA
Estimated Equity
$82,825
Purchase Details
Closed on
Aug 29, 2019
Sold by
Georgia Robert J and Simpson Georgia A
Bought by
Sim Pson Robert J and Sim Pson Georgia A
Purchase Details
Closed on
Dec 22, 2009
Sold by
Fannie Mae
Bought by
John Galt Enterprises Llc
Purchase Details
Closed on
Feb 5, 2009
Sold by
Mortgage Electronic Registration Systems
Bought by
Federal National Mortgage Association
Purchase Details
Closed on
Feb 4, 2009
Sold by
Wilson Joyce A
Bought by
Mortgage Electronic Registration Systems
Create a Home Valuation Report for This Property
The Home Valuation Report is an in-depth analysis detailing your home's value as well as a comparison with similar homes in the area
Home Values in the Area
Average Home Value in this Area
Purchase History
| Date | Buyer | Sale Price | Title Company |
|---|---|---|---|
| Sleder Amanda | $123,000 | None Listed On Document | |
| Sim Pson Robert J | -- | None Available | |
| John Galt Enterprises Llc | $14,053 | None Available | |
| Federal National Mortgage Association | -- | None Available | |
| Mortgage Electronic Registration Systems | $37,015 | None Available |
Source: Public Records
Mortgage History
| Date | Status | Borrower | Loan Amount |
|---|---|---|---|
| Open | Sleder Amanda | $100,122 |
Source: Public Records
Tax History
| Year | Tax Paid | Tax Assessment Tax Assessment Total Assessment is a certain percentage of the fair market value that is determined by local assessors to be the total taxable value of land and additions on the property. | Land | Improvement |
|---|---|---|---|---|
| 2025 | $3,722 | $93,800 | $0 | $0 |
| 2024 | $1,562 | $81,600 | $0 | $0 |
| 2023 | $992 | $60,700 | $0 | $0 |
| 2022 | $3,195 | $55,100 | $0 | $0 |
| 2021 | $3,118 | $52,400 | $0 | $0 |
| 2020 | $1,764 | $56,600 | $0 | $0 |
| 2019 | $1,747 | $56,300 | $0 | $0 |
| 2018 | $2,908 | $53,500 | $0 | $0 |
| 2017 | $2,760 | $46,800 | $0 | $0 |
| 2016 | $2,737 | $45,500 | $0 | $0 |
| 2015 | $2,590 | $48,200 | $0 | $0 |
| 2014 | $1,567 | $42,900 | $0 | $0 |
| 2012 | -- | $46,600 | $46,600 | $0 |
Source: Public Records
Map
Nearby Homes
- 5465 Johnson Rd
- 7067 W Stanley Rd
- 1449 Coutant St
- 433 Crestview St
- 1216 Pleasantview Dr
- 6273 Kelly Rd
- 515 Chestnut St
- 426 Bellewood Dr
- 507 Dale St
- 334 Cedarwood Dr
- 317 Oakwood Dr
- 162 Beacon Point Pkwy
- 6346 Squire Lake Dr Unit 33 Bldg 99
- 6320 Squire Lake Dr Unit 54
- 145 N Elms Rd
- 6356 Squire Lake Dr
- 621 Ashwood Dr
- 5194 Oleksyn Rd
- 0 Double Tree Estates
- 1252 Beatrice St
- 5456 N Elms Rd
- 6493 W Coldwater Rd
- 6507 W Coldwater Rd
- 5466 N Elms Rd
- 5500 N Elms Rd
- 5512 N Elms Rd
- 5448 N Elms Rd
- 5440 N Elms Rd
- 6443 W Coldwater Rd
- 5493 N Elms Rd
- 6482 W Coldwater Rd
- 5430 N Elms Rd
- 5519 N Elms Rd
- 5487 Bangor Ave
- 5477 Bangor Ave
- 5505 N Elms Rd
- 5497 Bangor Ave
- 5467 Bangor Ave
- 6470 W Coldwater Rd
- 6508 W Coldwater Rd
Your Personal Tour Guide
Ask me questions while you tour the home.