Estimated Value: $421,000 - $480,000
4
Beds
2
Baths
1,900
Sq Ft
$240/Sq Ft
Est. Value
About This Home
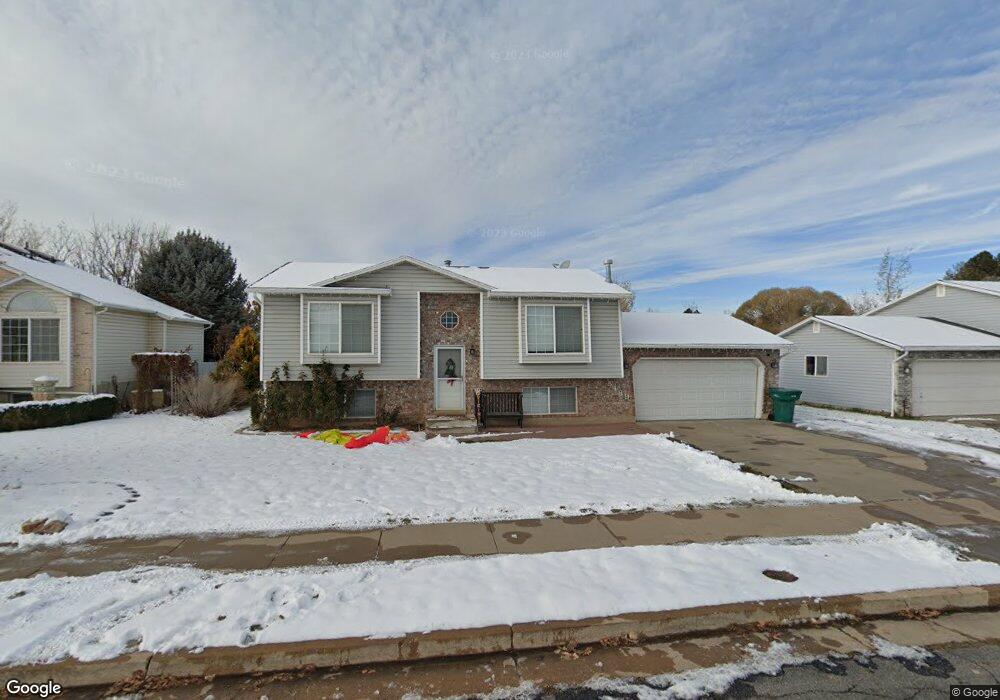
This home is located at 5489 S 3400 W, Roy, UT 84067 and is currently estimated at $456,906, approximately $240 per square foot. 5489 S 3400 W is a home located in Weber County with nearby schools including Roy Elementary School, Roy Junior High School, and Roy High School.
Ownership History
Date
Name
Owned For
Owner Type
Purchase Details
Closed on
Nov 1, 2021
Sold by
Emilio Martinez
Bought by
Stark Coleby
Current Estimated Value
Home Financials for this Owner
Home Financials are based on the most recent Mortgage that was taken out on this home.
Original Mortgage
$390,908
Outstanding Balance
$358,299
Interest Rate
3.01%
Mortgage Type
New Conventional
Estimated Equity
$98,607
Purchase Details
Closed on
Jun 8, 2020
Sold by
Martinez Emillo
Bought by
Martinez Emilio and Anderson Melinda
Home Financials for this Owner
Home Financials are based on the most recent Mortgage that was taken out on this home.
Original Mortgage
$75,000
Interest Rate
3.2%
Mortgage Type
Stand Alone Second
Purchase Details
Closed on
Nov 21, 2013
Sold by
Jorgensen Scott Larry and Jorgensen Becky A
Bought by
Martinez Emilio
Home Financials for this Owner
Home Financials are based on the most recent Mortgage that was taken out on this home.
Original Mortgage
$167,200
Interest Rate
4.18%
Mortgage Type
FHA
Create a Home Valuation Report for This Property
The Home Valuation Report is an in-depth analysis detailing your home's value as well as a comparison with similar homes in the area
Home Values in the Area
Average Home Value in this Area
Purchase History
| Date | Buyer | Sale Price | Title Company |
|---|---|---|---|
| Stark Coleby | -- | Us Title | |
| Martinez Emilio | -- | Us Title Insurance Agency | |
| Martinez Emilio | -- | Cottonwood Title Ins Agency |
Source: Public Records
Mortgage History
| Date | Status | Borrower | Loan Amount |
|---|---|---|---|
| Open | Stark Coleby | $390,908 | |
| Previous Owner | Martinez Emilio | $75,000 | |
| Previous Owner | Martinez Emilio | $167,200 |
Source: Public Records
Tax History Compared to Growth
Tax History
| Year | Tax Paid | Tax Assessment Tax Assessment Total Assessment is a certain percentage of the fair market value that is determined by local assessors to be the total taxable value of land and additions on the property. | Land | Improvement |
|---|---|---|---|---|
| 2025 | $2,786 | $443,480 | $136,790 | $306,690 |
| 2024 | $2,719 | $239,799 | $75,234 | $164,565 |
| 2023 | $2,617 | $231,000 | $74,205 | $156,795 |
| 2022 | $2,580 | $233,750 | $65,381 | $168,369 |
| 2021 | $2,222 | $332,000 | $88,036 | $243,964 |
| 2020 | $2,046 | $280,000 | $88,036 | $191,964 |
| 2019 | $2,084 | $270,000 | $52,408 | $217,592 |
| 2018 | $2,133 | $262,000 | $48,259 | $213,741 |
| 2017 | $1,906 | $218,000 | $48,259 | $169,741 |
| 2016 | $1,712 | $104,456 | $26,469 | $77,987 |
| 2015 | $1,664 | $104,456 | $23,685 | $80,771 |
| 2014 | $1,503 | $92,122 | $23,685 | $68,437 |
Source: Public Records
Map
Nearby Homes