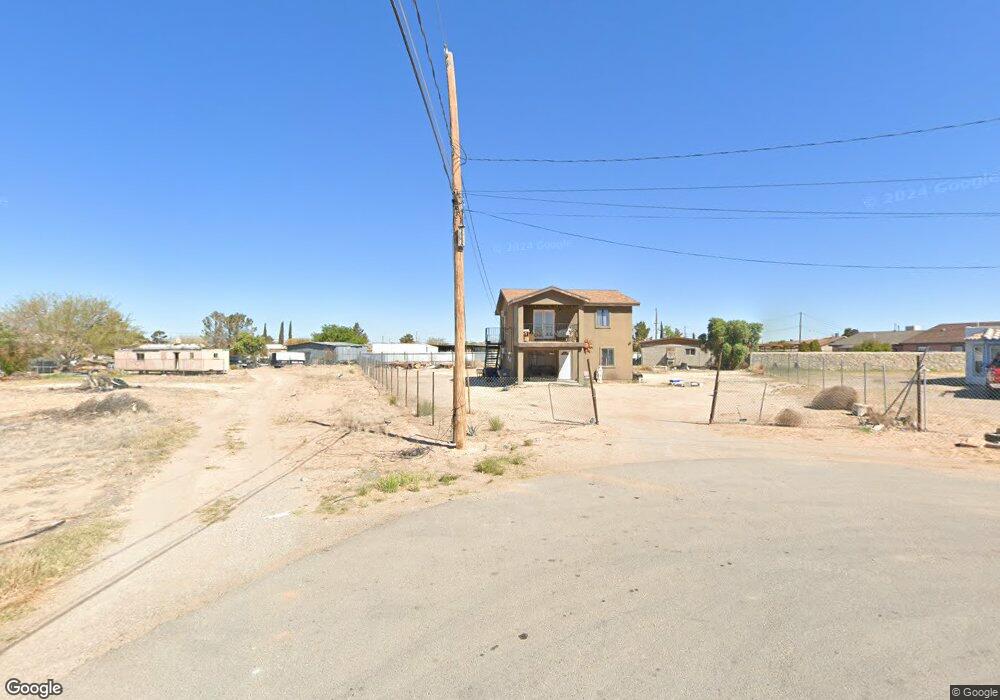
549 Agua Marina Place El Paso, TX 79928
Estimated Value: $217,834 - $522,000
4
Beds
2
Baths
1,632
Sq Ft
$194/Sq Ft
Est. Value
About This Home
This home is located at 549 Agua Marina Place, El Paso, TX 79928 and is currently estimated at $316,209, approximately $193 per square foot. 549 Agua Marina Place is a home with nearby schools including Carroll T. Welch Elementary School, Horizon Middle School, and Horizon High School.
Ownership History
Date
Name
Owned For
Owner Type
Purchase Details
Closed on
Sep 5, 2023
Sold by
Walters William Ross and Hope Sherry
Bought by
Anderson Hope Sherry and Buckles Louise
Current Estimated Value
Purchase Details
Closed on
Aug 27, 2023
Sold by
Yanez Jesus M
Bought by
Espinoza Silvia M
Purchase Details
Closed on
Aug 24, 2010
Sold by
Segovia Jesus and Segovia Dina R
Bought by
Yanez Jesus and Yanez Sylvia
Purchase Details
Closed on
Sep 18, 2009
Sold by
Ramos Oscar and Martinez Ann Christine
Bought by
Segovia Jesus and Segovia Dina R
Purchase Details
Closed on
Jul 28, 2003
Sold by
Kasco Ventures Inc
Bought by
Ramos Oscar
Home Financials for this Owner
Home Financials are based on the most recent Mortgage that was taken out on this home.
Original Mortgage
$19,825
Interest Rate
5.93%
Mortgage Type
Seller Take Back
Create a Home Valuation Report for This Property
The Home Valuation Report is an in-depth analysis detailing your home's value as well as a comparison with similar homes in the area
Home Values in the Area
Average Home Value in this Area
Purchase History
| Date | Buyer | Sale Price | Title Company |
|---|---|---|---|
| Anderson Hope Sherry | -- | None Listed On Document | |
| Espinoza Silvia M | -- | None Listed On Document | |
| Yanez Jesus | -- | None Available | |
| Segovia Jesus | -- | None Available | |
| Ramos Oscar | -- | -- |
Source: Public Records
Mortgage History
| Date | Status | Borrower | Loan Amount |
|---|---|---|---|
| Previous Owner | Ramos Oscar | $19,825 |
Source: Public Records
Tax History Compared to Growth
Tax History
| Year | Tax Paid | Tax Assessment Tax Assessment Total Assessment is a certain percentage of the fair market value that is determined by local assessors to be the total taxable value of land and additions on the property. | Land | Improvement |
|---|---|---|---|---|
| 2025 | $5,099 | $235,904 | $33,954 | $201,950 |
| 2024 | $5,099 | $235,904 | $28,554 | $207,350 |
| 2023 | $4,168 | $161,068 | $28,554 | $132,514 |
| 2022 | $3,984 | $146,585 | $25,128 | $121,457 |
| 2021 | $3,794 | $127,919 | $24,556 | $103,363 |
| 2020 | $3,025 | $105,113 | $24,556 | $80,557 |
| 2018 | $3,072 | $107,238 | $24,556 | $82,682 |
| 2017 | $2,678 | $94,668 | $13,555 | $81,113 |
| 2016 | $2,678 | $94,668 | $13,555 | $81,113 |
| 2015 | $1,638 | $76,890 | $13,555 | $63,335 |
| 2014 | $1,638 | $59,966 | $13,555 | $46,411 |
Source: Public Records
Map
Nearby Homes
- 561 Agua de Mar
- 12617 Hants Cir
- PN-376155 Tbd
- 15131 Alberton Ave
- 10 Acres Ascencion St
- 640 Agua Del Rio
- 616 Agua Clara St
- 637 Agua Clara St
- TBD Horizon City Estates Lot #11
- TBD 78 Tsp 4 Sec 14 T & P Abst 980
- PN-140091 Wickenburg Ct
- TBD Baxter Ave
- TBD Horizon City Estates Lot #45
- 79 TSP 3 Sec
- 704 Paseo Del Agua St
- 15554 Mechem St
- 15650 Ury St
- 15643 Attrill St
- 850 Agua Fria Place
- 725 Ingham St Unit 90
- 548 Agua Marina Place
- 521 Agua de Brisa
- 552 Agua Marina Place
- 520 Agua de Brisa
- 517 Agua de Brisa
- 536 Agua Clara St
- 556 Agua Marina Place
- 544 Agua Clara St
- 540 Agua Clara St
- 553 Agua de Mar
- 548 Agua Clara St
- 516 Agua de Brisa
- 561 Agua Marina Place
- 528 Agua Clara St
- 549 Agua de Mar
- 513 Agua de Brisa
- 517 Agua de Flor
- 521 Agua de Flor
- 524 Agua Clara St
- 556 Agua Clara St