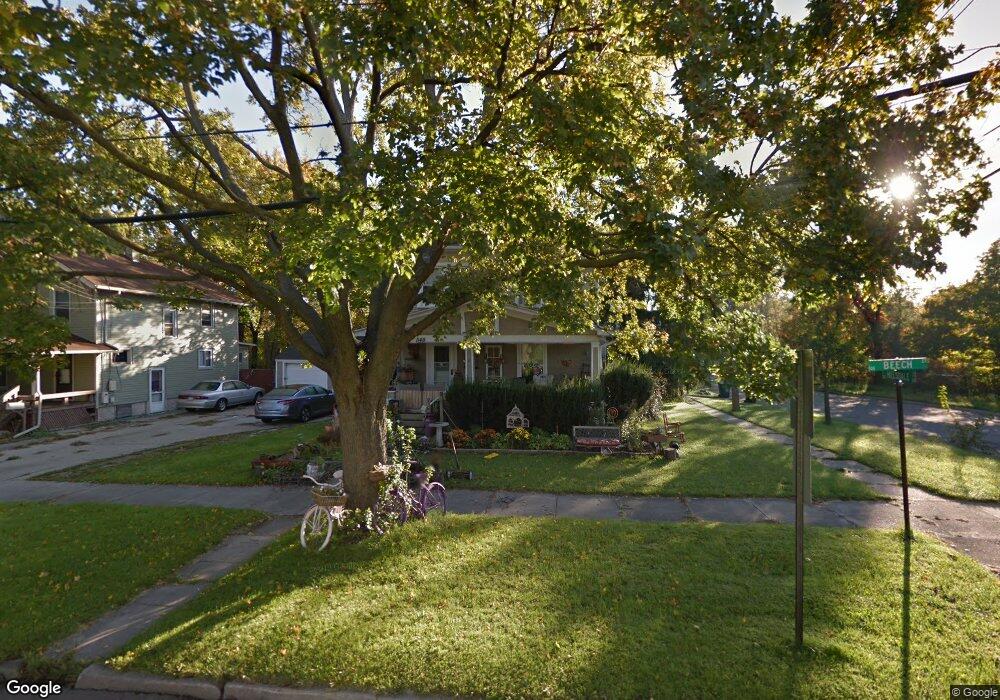
549 Beech St Lansing, MI 48912
The Stadium District NeighborhoodEstimated Value: $110,000 - $152,895
3
Beds
2
Baths
2,592
Sq Ft
$50/Sq Ft
Est. Value
About This Home
This home is located at 549 Beech St, Lansing, MI 48912 and is currently estimated at $128,724, approximately $49 per square foot. 549 Beech St is a home located in Ingham County with nearby schools including Riddle Elementary School, Pattengill Academy, and Eastern High School.
Ownership History
Date
Name
Owned For
Owner Type
Purchase Details
Closed on
Sep 17, 2019
Sold by
Schultz Joseph
Bought by
Hillman Brenda S and Hillman Donald L
Current Estimated Value
Home Financials for this Owner
Home Financials are based on the most recent Mortgage that was taken out on this home.
Original Mortgage
$55,250
Outstanding Balance
$48,395
Interest Rate
3.6%
Mortgage Type
New Conventional
Estimated Equity
$80,329
Purchase Details
Closed on
Jun 2, 2004
Sold by
Sturk Craig
Bought by
Schultz Joseph
Home Financials for this Owner
Home Financials are based on the most recent Mortgage that was taken out on this home.
Original Mortgage
$71,500
Interest Rate
6.17%
Mortgage Type
Purchase Money Mortgage
Purchase Details
Closed on
Oct 21, 1980
Sold by
Phillips Ernest and Phillips Mildred
Bought by
Sturk Craig
Purchase Details
Closed on
Oct 1, 1975
Sold by
Schram Schram C C and Schram Beatrice N
Bought by
Phillips Ernest and Phillips Mildred
Create a Home Valuation Report for This Property
The Home Valuation Report is an in-depth analysis detailing your home's value as well as a comparison with similar homes in the area
Home Values in the Area
Average Home Value in this Area
Purchase History
| Date | Buyer | Sale Price | Title Company |
|---|---|---|---|
| Hillman Brenda S | $65,000 | Ata National Title Group Llc | |
| Schultz Joseph | $66,000 | Professional Title & Mortgag | |
| Sturk Craig | $35,000 | -- | |
| Phillips Ernest | $19,500 | -- |
Source: Public Records
Mortgage History
| Date | Status | Borrower | Loan Amount |
|---|---|---|---|
| Open | Hillman Brenda S | $55,250 | |
| Previous Owner | Schultz Joseph | $71,500 |
Source: Public Records
Tax History
| Year | Tax Paid | Tax Assessment Tax Assessment Total Assessment is a certain percentage of the fair market value that is determined by local assessors to be the total taxable value of land and additions on the property. | Land | Improvement |
|---|---|---|---|---|
| 2025 | $3,877 | $75,000 | $4,900 | $70,100 |
| 2024 | $27 | $60,600 | $4,900 | $55,700 |
| 2023 | $3,204 | $55,400 | $4,900 | $50,500 |
| 2022 | $2,887 | $53,300 | $3,700 | $49,600 |
| 2021 | $2,827 | $47,200 | $4,300 | $42,900 |
| 2020 | $2,810 | $45,100 | $4,300 | $40,800 |
| 2019 | $2,834 | $39,400 | $4,300 | $35,100 |
| 2018 | $2,686 | $35,500 | $4,300 | $31,200 |
| 2017 | $2,586 | $35,500 | $4,300 | $31,200 |
| 2016 | $2,483 | $34,900 | $4,300 | $30,600 |
| 2015 | $2,483 | $33,800 | $8,557 | $25,243 |
| 2014 | $2,483 | $33,200 | $8,557 | $24,643 |
Source: Public Records
Map
Nearby Homes
- 527 Beech St
- 506 S East St
- 617 S Hosmer St
- 615 E Kalamazoo St
- 529 Cherry St
- 302 S 8th St
- 911 E Kalamazoo St
- 917 E Kalamazoo St
- 1001 Raider St
- 209 S Hosmer St
- 207 S Hosmer St
- 1006 S Pennsylvania Ave
- 1031 Bement St
- 1100 Hickory St
- 314 S Bingham St
- 500 E Michigan Ave Unit 411
- 329-337 S Washington Square
- 316 Jones St
- 1024 Eureka St
- 218 E Elm St
Your Personal Tour Guide
Ask me questions while you tour the home.