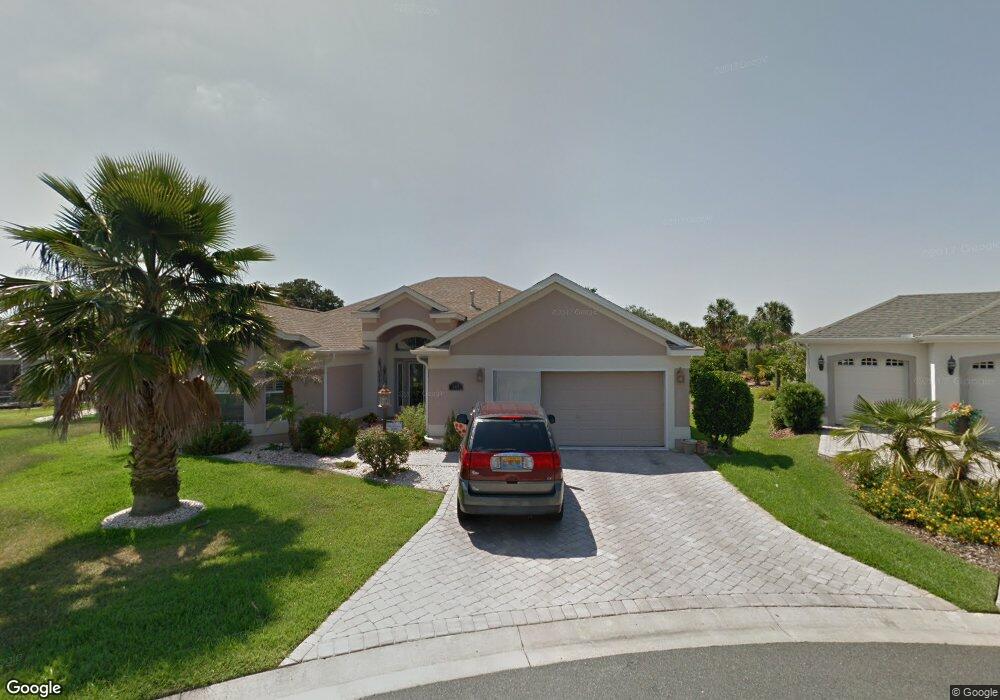
549 Brighton Dr The Villages, FL 32162
Village of Belvedere NeighborhoodEstimated Value: $550,000 - $752,148
3
Beds
2
Baths
3,005
Sq Ft
$214/Sq Ft
Est. Value
About This Home
This home is located at 549 Brighton Dr, The Villages, FL 32162 and is currently estimated at $642,037, approximately $213 per square foot. 549 Brighton Dr is a home located in Sumter County with nearby schools including Wildwood Elementary School, Wildwood Middle/High School, and Villages Charter School.
Ownership History
Date
Name
Owned For
Owner Type
Purchase Details
Closed on
Dec 21, 2022
Sold by
Gayle A Thompson Living Trust
Bought by
Thompson Dennis L and Thompson Gayle A
Current Estimated Value
Purchase Details
Closed on
May 9, 2014
Sold by
Graham Charles N
Bought by
Dennis L Thompson Living Trust and Thompson Gayle A
Purchase Details
Closed on
Mar 28, 2014
Sold by
Graham Charles N
Bought by
Graham Charles N
Purchase Details
Closed on
Dec 18, 2013
Sold by
Graham Charles N
Bought by
Graham Charles N and Donohue Sara M
Purchase Details
Closed on
Nov 1, 2011
Sold by
Riddick Jeryl W and Riddick Stacy J
Bought by
Graham Charles N
Purchase Details
Closed on
Aug 8, 2005
Sold by
Riddick Jeryl W and Riddick Harriett C
Bought by
Riddick Jeryl W and Riddick Harriett C
Create a Home Valuation Report for This Property
The Home Valuation Report is an in-depth analysis detailing your home's value as well as a comparison with similar homes in the area
Home Values in the Area
Average Home Value in this Area
Purchase History
| Date | Buyer | Sale Price | Title Company |
|---|---|---|---|
| Thompson Dennis L | $100 | -- | |
| Thompson Dennis L | $100 | None Listed On Document | |
| Dennis L Thompson Living Trust | $500,000 | Freedom Title & Escrow Compa | |
| Graham Charles N | -- | Attorney | |
| Graham Charles N | -- | Attorney | |
| Graham Charles N | $365,000 | Tri County Land Title & Escr | |
| Riddick Jeryl W | -- | -- |
Source: Public Records
Tax History Compared to Growth
Tax History
| Year | Tax Paid | Tax Assessment Tax Assessment Total Assessment is a certain percentage of the fair market value that is determined by local assessors to be the total taxable value of land and additions on the property. | Land | Improvement |
|---|---|---|---|---|
| 2025 | $6,558 | $628,450 | -- | -- |
| 2024 | $6,515 | $610,740 | $74,210 | $536,530 |
| 2023 | $6,515 | $613,880 | $49,480 | $564,400 |
| 2022 | $5,607 | $547,790 | $49,350 | $498,440 |
| 2021 | $5,158 | $400,220 | $49,350 | $350,870 |
| 2020 | $5,331 | $395,400 | $37,110 | $358,290 |
| 2019 | $5,775 | $365,090 | $37,110 | $327,980 |
| 2018 | $4,899 | $317,830 | $37,110 | $280,720 |
| 2017 | $5,047 | $319,920 | $37,110 | $282,810 |
| 2016 | $5,050 | $317,240 | $0 | $0 |
| 2015 | $5,050 | $311,170 | $0 | $0 |
| 2014 | $4,312 | $277,890 | $0 | $0 |
Source: Public Records
Map
Nearby Homes
- 2762 Morven Park Way
- 670 Fayette Ct
- 2670 Suffolk St
- 2690 Suffolk St
- 2746 Edwards Ln
- 2627 Ascot Loop
- 428 Canterbury Ct
- 420 Canterbury Ct
- 2757 Plainridge Loop
- 2879 Remington Rd
- 408 Rose Croft Terrace
- 616 Hartford Ln
- 720 Alcott Ave
- 4684 Arbor Way
- 776 Alcott Ave
- 560 Smithfield Place
- 2475 Laurel Bay Ln
- 610 Danbury St
- 10619 Grand Oaks Blvd
- 2415 Morven Park Way
- 553 Brighton Dr
- 550 Brighton Dr
- 609 Ravenel Ct
- 617 Ravenel Ct
- 557 Brighton Dr
- 625 Ravenel Ct Unit 80
- 556 Brighton Dr
- 601 Ravenel Ct
- 633 Ravenel Ct
- 561 Brighton Dr
- 632 Northam Terrace
- 621 Northam Terrace
- 641 Ravenel Ct
- 620 Ravenel Ct
- 600 Ravenel Ct
- 628 Ravenel Ct
- 627 Northam Terrace Unit 80
- 638 Northam Terrace
- 612 Ravenel Ct
- 608 Ravenel Ct