
Landlord's Agent in 2020
Seth Welcom
Re/Max Vision
(508) 842-3000
32 Total Sales

Estimated Value: $376,000 - $417,228
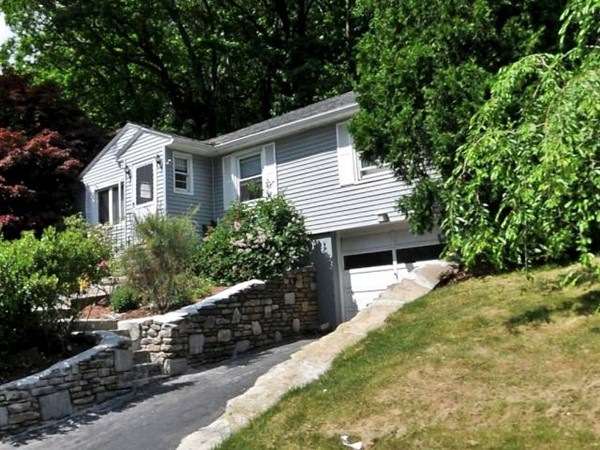
***Location, Location, Location*** Diagonally across the street from Worcester State University, if you lived any closer you'd be on campus, walk to everything this highly sought after area has to offer plus located on a busy WRTA bus route. Delightful three bedroom, two FULL bath home with finished walk-out lower level which adds an additional 500 +/- sq. ft. Terrific layout with eat-in kitchen and front to back LR/DR combination. Economical Gas Heat..!!! Hardwood Floors in the main living areas, tile floors in the kitchen. Recent windows to help keep the heating bills down and lots of convenient built-in storage. Lower level opens to a one car garage for easy access. Perfect location for Worcester State students of faculty. **AVAILABLE JUNE 1 2020 - Please read the showing instructions.**
We collect this data history from publicly available records. To have your information removed, we recommend requesting removal directly through your county’s website.
| Date | Buyer | Sale Price | Title Company |
|---|---|---|---|
| 4A&S Realty Llc | $123,000 | -- |
| Date | Event | Price | List to Sale | Price per Sq Ft |
|---|---|---|---|---|
| 05/15/2020 05/15/20 | Rented | $2,000 | 0.0% | -- |
| 05/15/2020 05/15/20 | Under Contract | -- | -- | -- |
| 04/13/2020 04/13/20 | For Rent | $2,000 | +33.3% | -- |
| 03/01/2016 03/01/16 | Rented | $1,500 | 0.0% | -- |
| 02/11/2016 02/11/16 | Under Contract | -- | -- | -- |
| 02/09/2016 02/09/16 | For Rent | $1,500 | -- | -- |
| Year | Tax Paid | Tax Assessment Tax Assessment Total Assessment is a certain percentage of the fair market value that is determined by local assessors to be the total taxable value of land and additions on the property. | Land | Improvement |
|---|---|---|---|---|
| 2025 | $4,711 | $357,200 | $119,000 | $238,200 |
| 2024 | $4,624 | $336,300 | $119,000 | $217,300 |
| 2023 | $4,465 | $311,400 | $103,400 | $208,000 |
| 2022 | $3,964 | $260,600 | $82,800 | $177,800 |
| 2021 | $3,819 | $234,600 | $66,200 | $168,400 |
| 2020 | $3,681 | $216,500 | $66,200 | $150,300 |
| 2019 | $3,469 | $192,700 | $59,700 | $133,000 |
| 2018 | $3,381 | $178,800 | $59,700 | $119,100 |
| 2017 | $3,437 | $178,800 | $59,700 | $119,100 |
| 2016 | $3,353 | $162,700 | $44,400 | $118,300 |
| 2015 | $3,265 | $162,700 | $44,400 | $118,300 |
| 2014 | $3,179 | $162,700 | $44,400 | $118,300 |
Landlord's Agent in 2020
Seth Welcom
Re/Max Vision
(508) 842-3000
32 Total Sales
Source: MLS Property Information Network (MLS PIN)
MLS Number: 72643313
APN: WORC-30-007-0004C
Disclaimer: Certain information contained herein is derived from information provided by parties other than Homes.com. All information provided is deemed reliable, but is not guaranteed to be accurate and should be independently verified.
![]() The property listing data and information, or the Images, set forth herein were provided to MLS Property Information Network, Inc. from third party sources, including sellers, lessors and public records, and were compiled by MLS Property Information Network, Inc. The property listing data and information, and the Images, are for the personal, non-commercial use of consumers having a good faith interest in purchasing or leasing listed properties of the type displayed to them and may not be used for any purpose other than to identify prospective properties which such consumers may have a good faith interest in purchasing or leasing. MLS Property Information Network, Inc. and its subscribers disclaim any and all representations and warranties as to the accuracy of the property listing data and information, or as to the accuracy of any of the Images, set forth herein.
The property listing data and information, or the Images, set forth herein were provided to MLS Property Information Network, Inc. from third party sources, including sellers, lessors and public records, and were compiled by MLS Property Information Network, Inc. The property listing data and information, and the Images, are for the personal, non-commercial use of consumers having a good faith interest in purchasing or leasing listed properties of the type displayed to them and may not be used for any purpose other than to identify prospective properties which such consumers may have a good faith interest in purchasing or leasing. MLS Property Information Network, Inc. and its subscribers disclaim any and all representations and warranties as to the accuracy of the property listing data and information, or as to the accuracy of any of the Images, set forth herein.
Ask me questions while you tour the home.