Estimated Value: $113,000 - $125,418
3
Beds
1
Bath
1,084
Sq Ft
$111/Sq Ft
Est. Value
About This Home
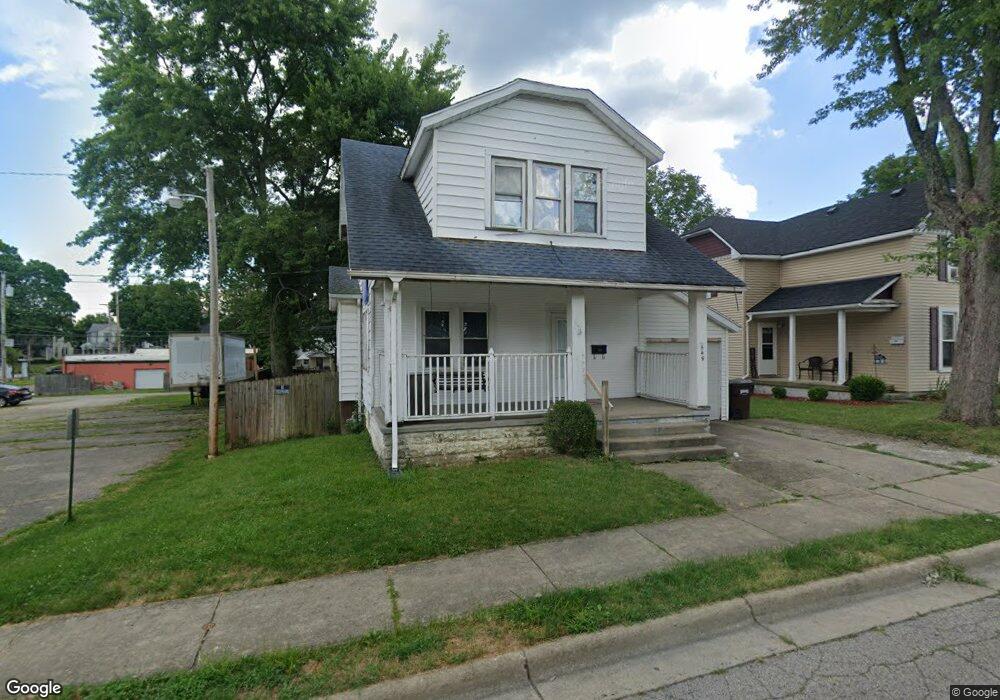
This home is located at 549 Chestnut St, Xenia, OH 45385 and is currently estimated at $120,855, approximately $111 per square foot. 549 Chestnut St is a home located in Greene County with nearby schools including Xenia High School, Summit Academy Community School for Alternative Learners - Xenia, and Legacy Christian Academy.
Ownership History
Date
Name
Owned For
Owner Type
Purchase Details
Closed on
May 11, 2022
Sold by
Vamos Gene R
Bought by
Vamos Gene Raymond and Vamos Judy Mae
Current Estimated Value
Purchase Details
Closed on
Aug 16, 2001
Sold by
Vamos Judy M
Bought by
Vamos Gene and Vamos Judy M
Home Financials for this Owner
Home Financials are based on the most recent Mortgage that was taken out on this home.
Original Mortgage
$48,800
Interest Rate
8.75%
Purchase Details
Closed on
Mar 24, 1999
Sold by
Hud
Bought by
Vamos Judy M
Home Financials for this Owner
Home Financials are based on the most recent Mortgage that was taken out on this home.
Original Mortgage
$28,800
Interest Rate
7.87%
Purchase Details
Closed on
Oct 23, 1998
Sold by
Randolph Billy D and Randolph Brenda G
Bought by
Hud
Purchase Details
Closed on
Jun 8, 1990
Bought by
Vamos Judy M and Vamos Vamos
Create a Home Valuation Report for This Property
The Home Valuation Report is an in-depth analysis detailing your home's value as well as a comparison with similar homes in the area
Home Values in the Area
Average Home Value in this Area
Purchase History
| Date | Buyer | Sale Price | Title Company |
|---|---|---|---|
| Vamos Gene Raymond | -- | Peterson And Peterson Llc | |
| Vamos Gene | -- | Cardinal First Title Inc | |
| Vamos Judy M | -- | Lawyers Title Ins Corp | |
| Hud | $32,000 | U S Title Agency Inc | |
| Vamos Judy M | $46,000 | -- |
Source: Public Records
Mortgage History
| Date | Status | Borrower | Loan Amount |
|---|---|---|---|
| Previous Owner | Vamos Gene | $48,800 | |
| Previous Owner | Vamos Judy M | $28,800 |
Source: Public Records
Tax History
| Year | Tax Paid | Tax Assessment Tax Assessment Total Assessment is a certain percentage of the fair market value that is determined by local assessors to be the total taxable value of land and additions on the property. | Land | Improvement |
|---|---|---|---|---|
| 2025 | $1,268 | $29,120 | $2,900 | $26,220 |
| 2024 | $1,268 | $29,120 | $2,900 | $26,220 |
| 2023 | $1,246 | $29,120 | $2,900 | $26,220 |
| 2022 | $1,091 | $21,750 | $2,320 | $19,430 |
| 2021 | $1,106 | $21,750 | $2,320 | $19,430 |
| 2020 | $1,060 | $21,750 | $2,320 | $19,430 |
| 2019 | $1,094 | $21,140 | $2,900 | $18,240 |
| 2018 | $1,098 | $21,140 | $2,900 | $18,240 |
| 2017 | $1,047 | $21,140 | $2,900 | $18,240 |
| 2016 | $1,047 | $19,780 | $2,900 | $16,880 |
| 2015 | $1,050 | $19,780 | $2,900 | $16,880 |
| 2014 | $1,005 | $19,780 | $2,900 | $16,880 |
Source: Public Records
Map
Nearby Homes
Your Personal Tour Guide
Ask me questions while you tour the home.