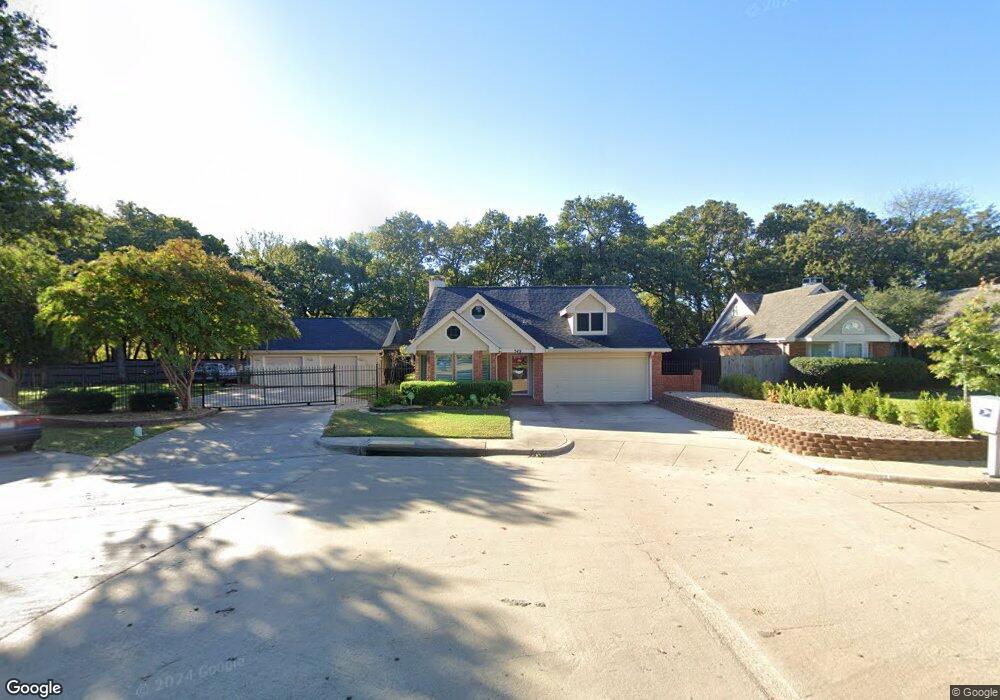
549 Dove Creek Cir Grapevine, TX 76051
Estimated Value: $413,095 - $453,000
3
Beds
2
Baths
1,396
Sq Ft
$311/Sq Ft
Est. Value
About This Home
This home is located at 549 Dove Creek Cir, Grapevine, TX 76051 and is currently estimated at $433,774, approximately $310 per square foot. 549 Dove Creek Cir is a home located in Tarrant County with nearby schools including Silver Lake Elementary School, Grapevine Middle, and Southlake Montessori.
Ownership History
Date
Name
Owned For
Owner Type
Purchase Details
Closed on
Feb 19, 2004
Sold by
Howard Roger D and Howard Brenda G
Bought by
Sinor James W
Current Estimated Value
Home Financials for this Owner
Home Financials are based on the most recent Mortgage that was taken out on this home.
Original Mortgage
$100,000
Outstanding Balance
$46,378
Interest Rate
5.67%
Mortgage Type
Purchase Money Mortgage
Estimated Equity
$387,396
Purchase Details
Closed on
Jan 27, 1999
Sold by
Obuehi Obinna
Bought by
Howard Roger D and Howard Brenda G
Home Financials for this Owner
Home Financials are based on the most recent Mortgage that was taken out on this home.
Original Mortgage
$136,000
Interest Rate
6.79%
Mortgage Type
VA
Purchase Details
Closed on
Jun 12, 1997
Sold by
Ellis Gerald Wayne
Bought by
Ogbuehi Obinna
Home Financials for this Owner
Home Financials are based on the most recent Mortgage that was taken out on this home.
Original Mortgage
$116,550
Interest Rate
7.93%
Create a Home Valuation Report for This Property
The Home Valuation Report is an in-depth analysis detailing your home's value as well as a comparison with similar homes in the area
Home Values in the Area
Average Home Value in this Area
Purchase History
| Date | Buyer | Sale Price | Title Company |
|---|---|---|---|
| Sinor James W | -- | Title Texas | |
| Howard Roger D | -- | Fidelity National Title Agen | |
| Ogbuehi Obinna | -- | Fidelity National Title Agen |
Source: Public Records
Mortgage History
| Date | Status | Borrower | Loan Amount |
|---|---|---|---|
| Open | Sinor James W | $100,000 | |
| Previous Owner | Howard Roger D | $136,000 | |
| Previous Owner | Ogbuehi Obinna | $116,550 | |
| Closed | Ogbuehi Obinna | $6,475 |
Source: Public Records
Tax History Compared to Growth
Tax History
| Year | Tax Paid | Tax Assessment Tax Assessment Total Assessment is a certain percentage of the fair market value that is determined by local assessors to be the total taxable value of land and additions on the property. | Land | Improvement |
|---|---|---|---|---|
| 2025 | $839 | $288,811 | $90,000 | $198,811 |
| 2024 | $839 | $353,372 | $90,000 | $263,372 |
| 2023 | $5,635 | $386,717 | $85,000 | $301,717 |
| 2022 | $6,054 | $305,554 | $50,000 | $255,554 |
| 2021 | $6,644 | $305,554 | $50,000 | $255,554 |
| 2020 | $6,177 | $280,821 | $50,000 | $230,821 |
| 2019 | $6,178 | $282,653 | $50,000 | $232,653 |
| 2018 | $854 | $246,261 | $50,000 | $196,261 |
| 2017 | $5,177 | $247,307 | $50,000 | $197,307 |
| 2016 | $4,707 | $227,477 | $50,000 | $177,477 |
| 2015 | $2,188 | $191,012 | $35,000 | $156,012 |
| 2014 | $2,188 | $168,200 | $25,000 | $143,200 |
Source: Public Records
Map
Nearby Homes
- 517 Yellowstone Dr
- 1201 Circle View Ct
- 841 Meadow Bend Loop W
- 1002 Meadow Bend Loop N
- 1801 Fern Ct
- 1707 Overlook Dr
- 2081 Holt Way
- 2221 Churchill Loop
- 2217 Cameron Crossing
- 1508 Bennington Ct
- 2140 S Winding Creek Dr
- 2092 Holt Way
- 460 Caviness Dr
- 6007 Laurel Ln
- 6011 Laurel Ln
- 1916 Everglade Ct
- 1024 Woodbriar Dr
- 218 W Peach St
- 613 Ball St
- 620 W College St
- 545 Dove Creek Cir
- 553 Dove Creek Cir
- 541 Dove Creek Cir
- 557 Dove Creek Cir
- 538 Dove Creek Cir
- 537 Dove Creek Cir
- 561 Dove Creek Cir
- 534 Dove Creek Cir
- 500 N Dove Rd
- 500 N Dove Rd
- 576 Dove Creek Cir
- 533 Dove Creek Cir
- 530 Dove Creek Cir
- 565 Dove Creek Cir
- 529 Dove Creek Cir
- 573 Dove Creek Cir
- 526 Dove Creek Cir
- 580 Dove Creek Cir
- 525 Dove Creek Cir
- 577 Dove Creek Cir