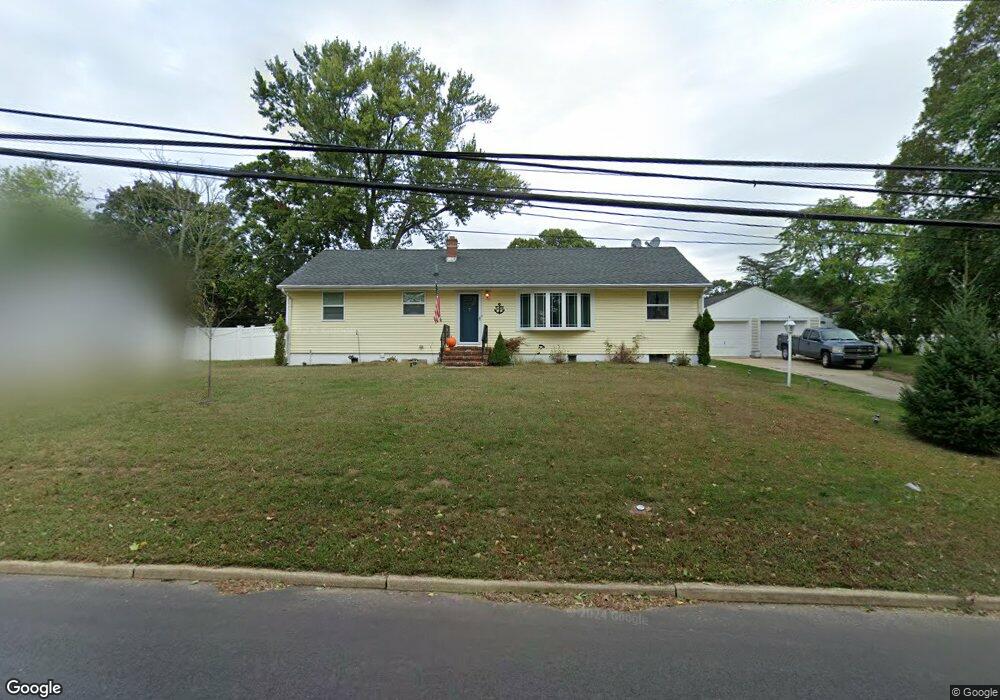
549 Dow Ave Oakhurst, NJ 07755
Estimated Value: $692,000 - $1,096,000
3
Beds
2
Baths
1,248
Sq Ft
$706/Sq Ft
Est. Value
About This Home
This home is located at 549 Dow Ave, Oakhurst, NJ 07755 and is currently estimated at $881,497, approximately $706 per square foot. 549 Dow Ave is a home located in Monmouth County with nearby schools including Ocean Township High School, St. Mary of the Assumption School, and Bet Yaakov of the Jersey Shore.
Ownership History
Date
Name
Owned For
Owner Type
Purchase Details
Closed on
Feb 25, 2014
Sold by
Fannie Mae
Bought by
Obrien Christopher and Obrien Elizabeth
Current Estimated Value
Home Financials for this Owner
Home Financials are based on the most recent Mortgage that was taken out on this home.
Original Mortgage
$224,800
Interest Rate
4.42%
Mortgage Type
New Conventional
Purchase Details
Closed on
Oct 21, 2003
Sold by
Stevens Clarence
Bought by
Rodrigues Alecina
Home Financials for this Owner
Home Financials are based on the most recent Mortgage that was taken out on this home.
Original Mortgage
$268,000
Interest Rate
5.98%
Create a Home Valuation Report for This Property
The Home Valuation Report is an in-depth analysis detailing your home's value as well as a comparison with similar homes in the area
Home Values in the Area
Average Home Value in this Area
Purchase History
| Date | Buyer | Sale Price | Title Company |
|---|---|---|---|
| Obrien Christopher | -- | None Available | |
| Rodrigues Alecina | $335,000 | -- |
Source: Public Records
Mortgage History
| Date | Status | Borrower | Loan Amount |
|---|---|---|---|
| Previous Owner | Obrien Christopher | $224,800 | |
| Previous Owner | Rodrigues Alecina | $268,000 |
Source: Public Records
Tax History
| Year | Tax Paid | Tax Assessment Tax Assessment Total Assessment is a certain percentage of the fair market value that is determined by local assessors to be the total taxable value of land and additions on the property. | Land | Improvement |
|---|---|---|---|---|
| 2025 | $10,585 | $796,500 | $622,300 | $174,200 |
| 2024 | $9,972 | $742,300 | $575,300 | $167,000 |
| 2023 | $9,972 | $652,200 | $489,800 | $162,400 |
| 2022 | $8,648 | $498,500 | $343,900 | $154,600 |
| 2021 | $8,648 | $440,100 | $315,400 | $124,700 |
| 2020 | $9,099 | $457,000 | $323,000 | $134,000 |
| 2019 | $8,405 | $412,200 | $262,200 | $150,000 |
| 2018 | $7,193 | $343,500 | $200,500 | $143,000 |
| 2017 | $6,992 | $332,500 | $186,200 | $146,300 |
| 2016 | $7,507 | $321,100 | $186,200 | $134,900 |
| 2015 | $7,553 | $327,100 | $195,700 | $131,400 |
| 2014 | $7,219 | $316,900 | $195,700 | $121,200 |
Source: Public Records
Map
Nearby Homes
- 186 Whalepond Rd
- 120 Whalepond Rd
- 104 Pear St
- 96 Whalepond Rd
- 489 Freehold St
- 221 Harrison Ave
- 603 Carol Ave
- 197 Delaware Ave
- 8 Corey Dr
- 201 Freehold St
- 227 Chatham Ave
- 450 Wells Ave
- 441 Slocum Place
- 1904 Waverly St
- 35 Shadow Lawn Dr
- 130 Woolley Ct
- 471 W Park Ave
- 185 Pinecrest Rd
- 187 Pinecrest Rd
- 432 W Park Ave
Your Personal Tour Guide
Ask me questions while you tour the home.