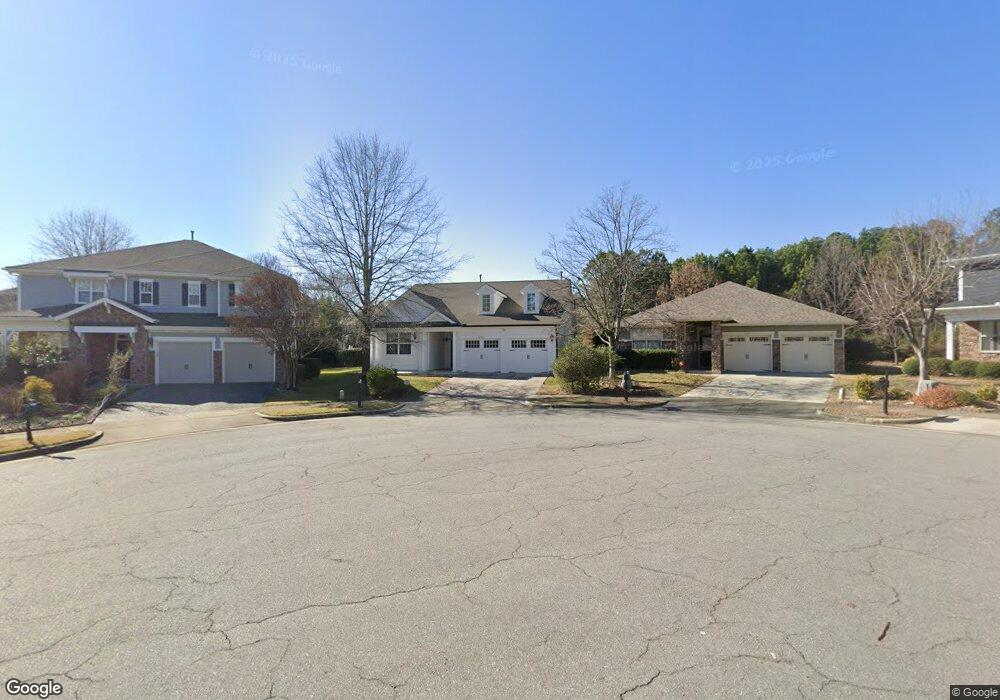
549 Front Ridge Dr Cary, NC 27519
Twin Lakes NeighborhoodEstimated Value: $643,000 - $671,992
3
Beds
2
Baths
2,208
Sq Ft
$299/Sq Ft
Est. Value
About This Home
This home is located at 549 Front Ridge Dr, Cary, NC 27519 and is currently estimated at $661,248, approximately $299 per square foot. 549 Front Ridge Dr is a home located in Wake County with nearby schools including Cedar Fork Elementary, West Cary Middle School, and Panther Creek High School.
Ownership History
Date
Name
Owned For
Owner Type
Purchase Details
Closed on
Oct 3, 2021
Sold by
Basavakumar Chandan and Basavakumar Hanumantha Chaithra
Bought by
Rasavakumar Chandan and Rasavakumar Hanumantha Chaithra
Current Estimated Value
Purchase Details
Closed on
Mar 25, 2020
Sold by
Merendoni William E and Merendoni Keiko H
Bought by
Basavakumar Chandan and Basavakumar Hanumantha Chaithra
Home Financials for this Owner
Home Financials are based on the most recent Mortgage that was taken out on this home.
Original Mortgage
$295,000
Outstanding Balance
$232,688
Interest Rate
3.4%
Mortgage Type
New Conventional
Estimated Equity
$428,560
Purchase Details
Closed on
Nov 10, 2015
Sold by
Stacey Ronald J and Stacey Maria Dolores G
Bought by
Merendoni William E and Merendoni Keiko H
Purchase Details
Closed on
Dec 15, 2006
Sold by
Kb Home Raleigh Durham Inc
Bought by
Stacey Ronald J and Stacey Maria Dolores G
Create a Home Valuation Report for This Property
The Home Valuation Report is an in-depth analysis detailing your home's value as well as a comparison with similar homes in the area
Home Values in the Area
Average Home Value in this Area
Purchase History
| Date | Buyer | Sale Price | Title Company |
|---|---|---|---|
| Rasavakumar Chandan | -- | None Available | |
| Basavakumar Chandan | $395,000 | None Available | |
| Merendoni William E | $3,470,000 | None Available | |
| Stacey Ronald J | $315,000 | None Available |
Source: Public Records
Mortgage History
| Date | Status | Borrower | Loan Amount |
|---|---|---|---|
| Open | Basavakumar Chandan | $295,000 |
Source: Public Records
Tax History
| Year | Tax Paid | Tax Assessment Tax Assessment Total Assessment is a certain percentage of the fair market value that is determined by local assessors to be the total taxable value of land and additions on the property. | Land | Improvement |
|---|---|---|---|---|
| 2025 | $5,274 | $613,035 | $180,000 | $433,035 |
| 2024 | $5,160 | $613,035 | $180,000 | $433,035 |
Source: Public Records
Map
Nearby Homes
- 3147 Rapid Falls Rd
- 170 Point Comfort Ln
- 548 Abbey Fields Loop
- 316 Valley Glen Dr
- 541 Berry Chase Way
- 605 Beech Hanger Dr
- 113 Concordia Woods Dr
- 1017 Craigmeade Dr
- 106 Honeycomb Ln
- 600 Courthouse Dr
- 417 Downing Glen Dr
- 1329 Alemany St
- 226 Leacroft Way
- 313 Indian Branch Dr
- 105 Bayless Ridge Ct
- 1219 Foxglove Dr
- 309 Malvern Hill Ln
- 1212 Checkerberry Dr Unit 34
- 1116 Checkerberry Dr
- 1213 Grenshaw Dr
- 547 Front Ridge Dr
- 551 Front Ridge Dr
- 410 Otter Cliff Way
- 408 Otter Cliff Way
- 553 Front Ridge Dr
- 545 Front Ridge Dr
- 412 Otter Cliff Way
- 406 Otter Cliff Way
- 554 Front Ridge Dr
- 543 Front Ridge Dr
- 416 Otter Cliff Way
- 404 Otter Cliff Way
- 552 Front Ridge Dr
- 548 Front Ridge Dr
- 541 Front Ridge Dr
- 546 Front Ridge Dr
- 550 Front Ridge Dr
- 544 Front Ridge Dr
- 402 Otter Cliff Way
- 418 Otter Cliff Way
Your Personal Tour Guide
Ask me questions while you tour the home.