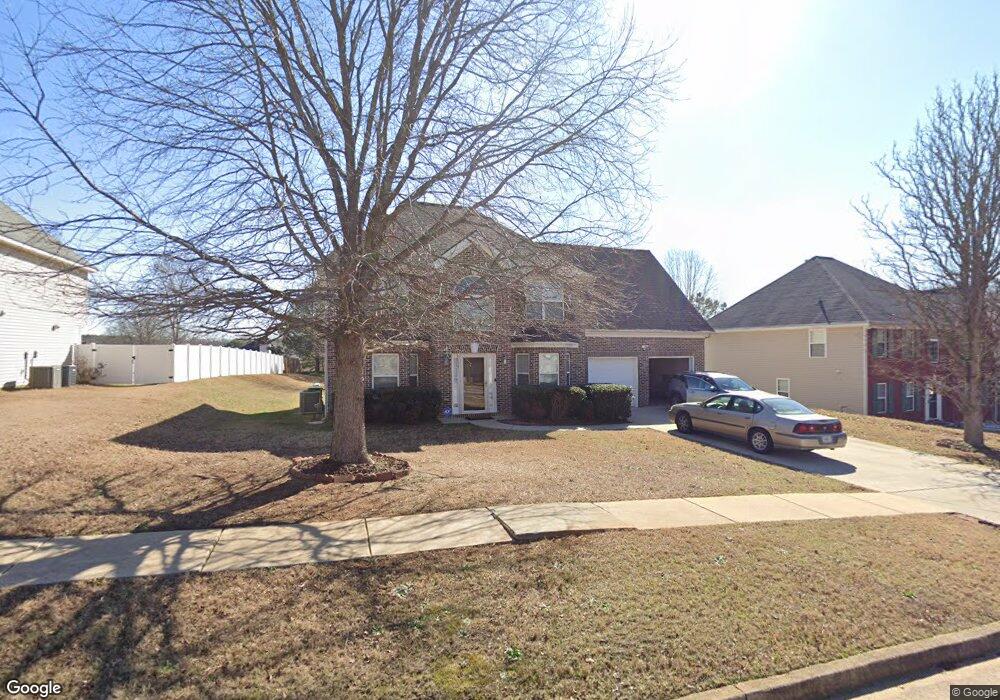
549 Howell Dr Unit 2 Locust Grove, GA 30248
Estimated Value: $340,525 - $377,000
4
Beds
3
Baths
2,705
Sq Ft
$133/Sq Ft
Est. Value
About This Home
This home is located at 549 Howell Dr Unit 2, Locust Grove, GA 30248 and is currently estimated at $359,881, approximately $133 per square foot. 549 Howell Dr Unit 2 is a home located in Henry County with nearby schools including Bethlehem Elementary School, Luella Middle School, and Luella High School.
Ownership History
Date
Name
Owned For
Owner Type
Purchase Details
Closed on
Sep 15, 2014
Sold by
Ravenell Anthony Dexter
Bought by
Ravenell Serena Johnson
Current Estimated Value
Purchase Details
Closed on
Feb 15, 2007
Sold by
Breyerton Communities Inc
Bought by
Ravenell Anthony D and Ravenell Serena J
Home Financials for this Owner
Home Financials are based on the most recent Mortgage that was taken out on this home.
Original Mortgage
$150,400
Interest Rate
6.25%
Mortgage Type
New Conventional
Create a Home Valuation Report for This Property
The Home Valuation Report is an in-depth analysis detailing your home's value as well as a comparison with similar homes in the area
Home Values in the Area
Average Home Value in this Area
Purchase History
| Date | Buyer | Sale Price | Title Company |
|---|---|---|---|
| Ravenell Serena Johnson | -- | -- | |
| Ravenell Anthony D | $100,000 | -- |
Source: Public Records
Mortgage History
| Date | Status | Borrower | Loan Amount |
|---|---|---|---|
| Previous Owner | Ravenell Anthony D | $150,400 |
Source: Public Records
Tax History Compared to Growth
Tax History
| Year | Tax Paid | Tax Assessment Tax Assessment Total Assessment is a certain percentage of the fair market value that is determined by local assessors to be the total taxable value of land and additions on the property. | Land | Improvement |
|---|---|---|---|---|
| 2025 | $5,441 | $135,840 | $16,000 | $119,840 |
| 2024 | $5,441 | $136,160 | $16,000 | $120,160 |
| 2023 | $5,368 | $138,080 | $14,800 | $123,280 |
| 2022 | $4,605 | $118,200 | $14,800 | $103,400 |
| 2021 | $3,445 | $87,960 | $14,800 | $73,160 |
| 2020 | $3,264 | $83,240 | $10,000 | $73,240 |
| 2019 | $2,929 | $74,520 | $10,000 | $64,520 |
| 2018 | $2,719 | $69,040 | $8,000 | $61,040 |
| 2016 | $2,538 | $64,320 | $8,000 | $56,320 |
| 2015 | $2,460 | $60,400 | $8,000 | $52,400 |
| 2014 | $2,469 | $59,920 | $8,000 | $51,920 |
Source: Public Records
Map
Nearby Homes
- 640 Howell Dr
- 512 Vickers Ln
- 412 Eglington Trail
- 1220 Nottley Dr
- 633 Jervis Way
- 115 N Chesapeake Bay Dr
- 112 Leveret Rd
- 1360 Luella Rd
- 119 Bantry Way
- 214 Georgian Way
- 1429 Kentmire Ct
- 2336 Mcintosh Dr
- 1171 Bodega Loop
- 2356 Mcintosh Dr
- 1913 Avondale Ct
- 2439 Mcintosh Dr
- 1729 Cadence St
- 271 Trestle Rd
- 3157 Highway 155
- 274 Linford Dr