549 Main St Hudson, MA 01749
Estimated Value: $621,000 - $774,000
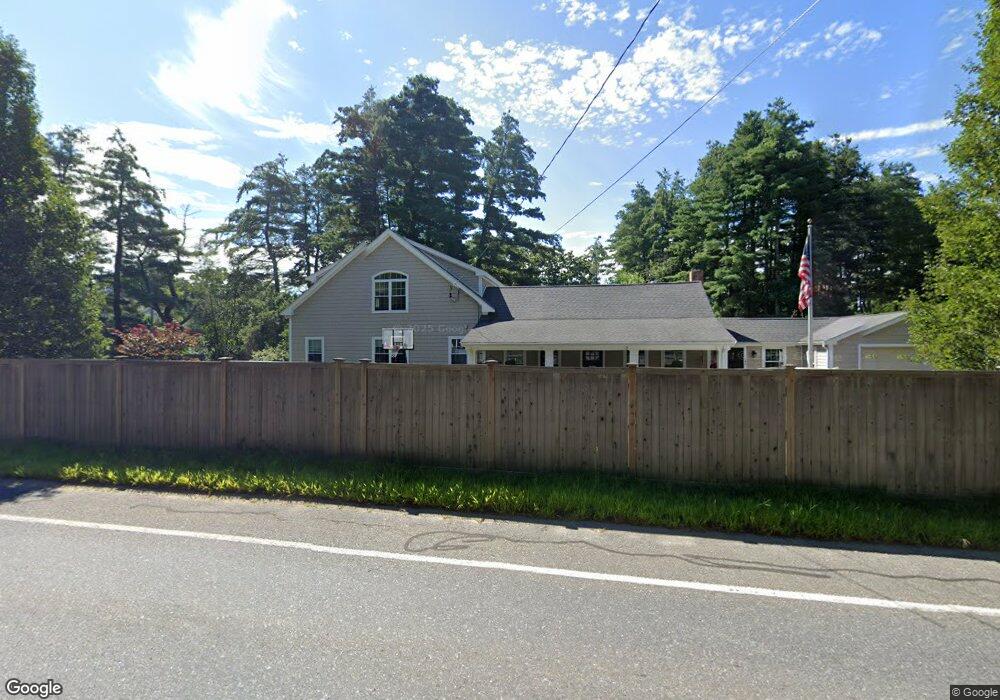
About This Home
This home is located at 549 Main St, Hudson, MA 01749 and is currently estimated at $690,880, approximately $345 per square foot. 549 Main St is a home located in Middlesex County with nearby schools including David J. Quinn Middle School, Hudson High School, and First Steps Children's Center.
Ownership History
We collect this data history from publicly available records. To have your information removed, we recommend requesting removal directly through your county’s website.
Purchase Details
Home Financials for this Owner
Home Financials are based on the most recent Mortgage that was taken out on this home.Home Values in the Area
Average Home Value in this Area
Purchase History
We collect this data history from publicly available records. To have your information removed, we recommend requesting removal directly through your county’s website.
| Date | Buyer | Sale Price | Title Company |
|---|---|---|---|
| $235,000 | -- | ||
| $235,000 | -- | ||
| $235,000 | -- |
Mortgage History
We collect this data history from publicly available records. To have your information removed, we recommend requesting removal directly through your county’s website.
| Date | Status | Borrower | Loan Amount |
|---|---|---|---|
| Open | $223,250 | ||
| Closed | $223,250 | ||
| Previous Owner | $100,000 | ||
| Previous Owner | $50,000 |
Tax History
We collect this data history from publicly available records. To have your information removed, we recommend requesting removal directly through your county’s website.
| Year | Tax Paid | Tax Assessment Tax Assessment Total Assessment is a certain percentage of the fair market value that is determined by local assessors to be the total taxable value of land and additions on the property. | Land | Improvement |
|---|---|---|---|---|
| 2025 | $7,706 | $555,200 | $202,700 | $352,500 |
| 2024 | $7,115 | $508,200 | $184,200 | $324,000 |
| 2023 | $7,007 | $479,900 | $177,100 | $302,800 |
| 2022 | $6,886 | $434,200 | $161,000 | $273,200 |
| 2021 | $6,714 | $404,700 | $153,500 | $251,200 |
| 2020 | $6,250 | $376,300 | $150,500 | $225,800 |
| 2019 | $6,379 | $374,600 | $150,500 | $224,100 |
| 2018 | $4,207 | $340,400 | $143,400 | $197,000 |
| 2017 | $4,233 | $241,900 | $136,600 | $105,300 |
| 2016 | $4,499 | $260,200 | $136,600 | $123,600 |
| 2015 | $4,012 | $232,300 | $122,800 | $109,500 |
| 2014 | $3,791 | $217,600 | $107,600 | $110,000 |
Map
- 22 Sauta Farm Way
- 144 Brook St
- 155 Brook St
- 10 West Ave
- 307 Chestnut St
- 92 Hosmer St
- 33 Russo Dr
- 2 Marlboro Rd
- 12 Murphy Rd
- 106 Causeway St
- 1 Town Line Rd Unit 18
- 66 Pine Point Rd
- 5 Shore Line Rd
- 786 Main St
- 27 Richardson Rd
- 1 Glendale Rd
- 4 Richardson Rd
- 133 White Pond Rd
- 7 Richard Rd
- 649 Concord Rd
Ask me questions while you tour the home.