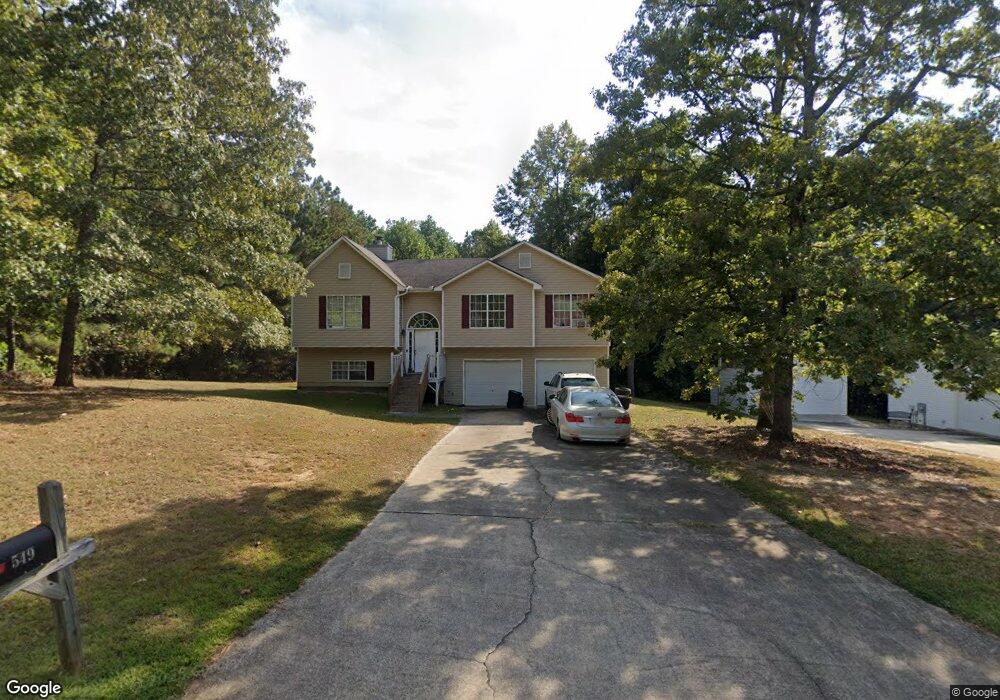
549 Preston Place Ct Carrollton, GA 30117
Estimated Value: $262,456 - $281,000
3
Beds
2
Baths
1,345
Sq Ft
$201/Sq Ft
Est. Value
About This Home
This home is located at 549 Preston Place Ct, Carrollton, GA 30117 and is currently estimated at $270,614, approximately $201 per square foot. 549 Preston Place Ct is a home located in Carroll County with nearby schools including Bowdon Elementary School, Bowdon Middle School, and Bowdon High School.
Ownership History
Date
Name
Owned For
Owner Type
Purchase Details
Closed on
Sep 26, 2007
Sold by
Chariot Homes Inc
Bought by
Prothro Frederica Lasha
Current Estimated Value
Home Financials for this Owner
Home Financials are based on the most recent Mortgage that was taken out on this home.
Original Mortgage
$119,900
Outstanding Balance
$75,634
Interest Rate
6.41%
Mortgage Type
New Conventional
Estimated Equity
$194,980
Purchase Details
Closed on
Nov 7, 2006
Sold by
Not Provided
Bought by
Prothro Frederica Lasha
Purchase Details
Closed on
Sep 9, 2004
Sold by
Chariot Homes Inc
Bought by
Allen Earnest J
Purchase Details
Closed on
May 9, 2004
Sold by
Gregory William J
Bought by
Chariot Homes Inc
Purchase Details
Closed on
Feb 7, 2003
Sold by
Chariot Homes Inc
Bought by
Gregory William J
Purchase Details
Closed on
Oct 11, 2001
Sold by
Coleman Eugene W
Bought by
Chariot Homes Inc
Purchase Details
Closed on
Sep 5, 2001
Bought by
Coleman Eugene W
Create a Home Valuation Report for This Property
The Home Valuation Report is an in-depth analysis detailing your home's value as well as a comparison with similar homes in the area
Home Values in the Area
Average Home Value in this Area
Purchase History
| Date | Buyer | Sale Price | Title Company |
|---|---|---|---|
| Prothro Frederica Lasha | $119,900 | -- | |
| Prothro Frederica Lasha | -- | -- | |
| Allen Earnest J | $110,000 | -- | |
| Chariot Homes Inc | -- | -- | |
| Gregory William J | $109,400 | -- | |
| Chariot Homes Inc | $195,000 | -- | |
| Coleman Eugene W | -- | -- |
Source: Public Records
Mortgage History
| Date | Status | Borrower | Loan Amount |
|---|---|---|---|
| Open | Prothro Frederica Lasha | $119,900 |
Source: Public Records
Tax History Compared to Growth
Tax History
| Year | Tax Paid | Tax Assessment Tax Assessment Total Assessment is a certain percentage of the fair market value that is determined by local assessors to be the total taxable value of land and additions on the property. | Land | Improvement |
|---|---|---|---|---|
| 2024 | $1,679 | $93,307 | $6,000 | $87,307 |
| 2023 | $1,679 | $85,388 | $6,000 | $79,388 |
| 2022 | $1,421 | $69,744 | $6,000 | $63,744 |
| 2021 | $1,292 | $60,617 | $6,000 | $54,617 |
| 2020 | $1,177 | $54,139 | $6,000 | $48,139 |
| 2019 | $1,128 | $51,017 | $6,000 | $45,017 |
| 2018 | $1,130 | $50,357 | $6,936 | $43,421 |
| 2017 | $1,132 | $50,357 | $6,936 | $43,421 |
| 2016 | $1,133 | $50,357 | $6,936 | $43,421 |
| 2015 | $999 | $39,737 | $6,936 | $32,802 |
| 2014 | $1,004 | $39,738 | $6,936 | $32,802 |
Source: Public Records
Map
Nearby Homes
- 543 Preston Place Ct
- 0 Preston Place Ct Unit 8161960
- 552 Preston Place Ct
- 537 Preston Place Ct
- 540 Preston Place Ct
- 561 Preston Place Ct
- 534 Preston Place Ct
- 531 Preston Place Ct
- 4538 W Highway 166
- 4504 W Highway 166
- 566 Preston Place Ct
- 525 Preston Place Ct
- 4628 W Highway 166
- 519 Preston Place Ct
- 564 Preston Place Ct
- 500 Preston Place Ct
- 513 Preston Place Ct
- 137 Red Oak Dr
- 77 Red Oak Dr
- 4547 W Highway 166