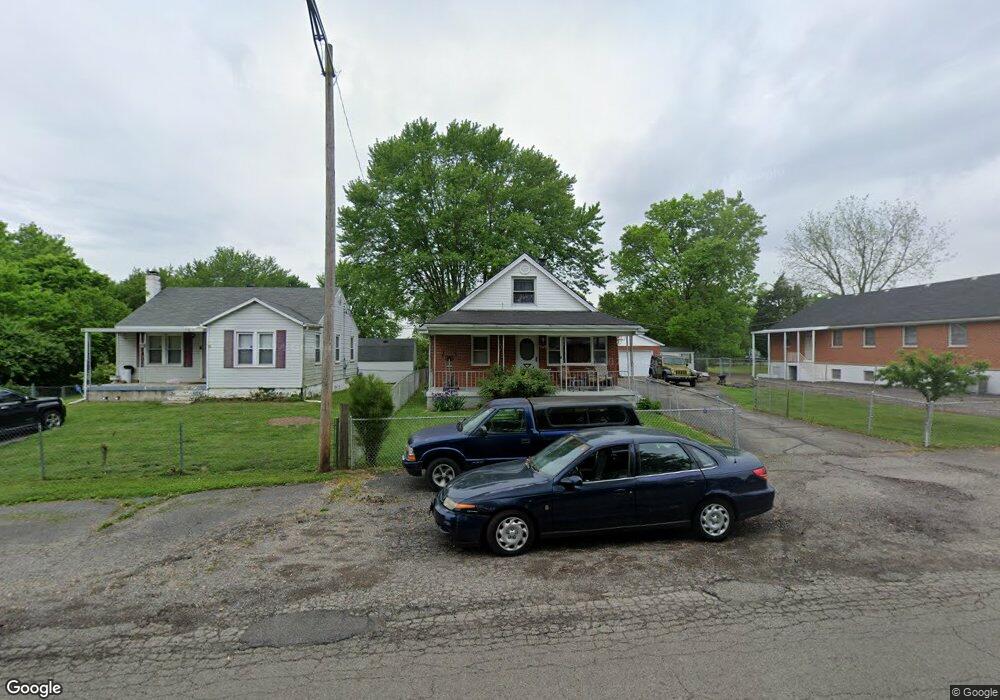
549 Prince Albert Blvd Dayton, OH 45404
Avondale NeighborhoodEstimated Value: $159,000 - $179,000
6
Beds
4
Baths
1,620
Sq Ft
$104/Sq Ft
Est. Value
About This Home
This home is located at 549 Prince Albert Blvd, Dayton, OH 45404 and is currently estimated at $169,239, approximately $104 per square foot. 549 Prince Albert Blvd is a home located in Montgomery County with nearby schools including Stebbins High School, Pathway School of Discovery, and Horizon Science Academy Dayton Downtown.
Ownership History
Date
Name
Owned For
Owner Type
Purchase Details
Closed on
May 1, 2009
Sold by
Caudill Russell and Caudill Margie
Bought by
Ison Ralph
Current Estimated Value
Home Financials for this Owner
Home Financials are based on the most recent Mortgage that was taken out on this home.
Original Mortgage
$98,188
Outstanding Balance
$62,037
Interest Rate
4.85%
Mortgage Type
FHA
Estimated Equity
$107,202
Purchase Details
Closed on
Dec 14, 2000
Sold by
Caudill Russell
Bought by
Caudill Russell and Caudill Margie
Home Financials for this Owner
Home Financials are based on the most recent Mortgage that was taken out on this home.
Original Mortgage
$70,000
Interest Rate
7.8%
Purchase Details
Closed on
Dec 13, 2000
Sold by
Caudill Daniel Clay and Caudill Russell Dwight
Bought by
Caudill Russell and Caudill Margie
Home Financials for this Owner
Home Financials are based on the most recent Mortgage that was taken out on this home.
Original Mortgage
$70,000
Interest Rate
7.8%
Create a Home Valuation Report for This Property
The Home Valuation Report is an in-depth analysis detailing your home's value as well as a comparison with similar homes in the area
Home Values in the Area
Average Home Value in this Area
Purchase History
| Date | Buyer | Sale Price | Title Company |
|---|---|---|---|
| Ison Ralph | $100,000 | Attorney | |
| Caudill Russell | -- | -- | |
| Caudill Russell | -- | -- | |
| Caudill Russell | -- | -- |
Source: Public Records
Mortgage History
| Date | Status | Borrower | Loan Amount |
|---|---|---|---|
| Open | Ison Ralph | $98,188 | |
| Previous Owner | Caudill Russell | $70,000 |
Source: Public Records
Tax History Compared to Growth
Tax History
| Year | Tax Paid | Tax Assessment Tax Assessment Total Assessment is a certain percentage of the fair market value that is determined by local assessors to be the total taxable value of land and additions on the property. | Land | Improvement |
|---|---|---|---|---|
| 2024 | $1,962 | $40,960 | $4,330 | $36,630 |
| 2023 | $1,962 | $40,960 | $4,330 | $36,630 |
| 2022 | $2,095 | $32,770 | $3,460 | $29,310 |
| 2021 | $2,135 | $32,770 | $3,460 | $29,310 |
| 2020 | $2,135 | $32,770 | $3,460 | $29,310 |
| 2019 | $2,418 | $33,190 | $3,120 | $30,070 |
| 2018 | $2,423 | $33,190 | $3,120 | $30,070 |
| 2017 | $2,422 | $33,190 | $3,120 | $30,070 |
| 2016 | $2,408 | $32,020 | $3,460 | $28,560 |
| 2015 | $2,526 | $32,020 | $3,460 | $28,560 |
| 2014 | $2,526 | $32,020 | $3,460 | $28,560 |
| 2012 | -- | $28,190 | $3,460 | $24,730 |
Source: Public Records
Map
Nearby Homes
- 641 Prince Albert Blvd
- - Prince Albert Blvd
- -- Prince Albert Blvd
- 518 Tyron Ave
- 546 Wynora Ave
- 241 Community Dr
- - Rondowa Ave
- -- Rondowa Ave
- 2249 Prince Albert Blvd
- 2249 Valley Pike
- 2460 Bushnell Ave
- 2245 Valley Pike
- 1930 Brandt Pike
- -- Valley Pike
- - Valley Pike
- 2249 - Valley Pike
- 2301 Valley Pike
- 3586 Lane Garden Ct
- 34 Ingleside Ave
- 29 Barcelona Ave
- 508 Prince Albert Blvd
- 530 Lorella Ave
- 504 Prince Albert Blvd
- 502 Prince Albert Blvd
- 515 Prince Albert Blvd
- 519 Prince Albert Blvd
- 550 Prince Albert Blvd
- 601 Prince Albert Blvd
- 507 Prince Albert Blvd
- 1000 Broadmead Ave
- 600 Lorella Ave
- 503 Prince Albert Blvd
- 603 Prince Albert Blvd
- 529 Lorella Ave
- 600 Prince Albert Blvd
- 531 Lorella Ave
- 525 Lorella Ave
- 501 Prince Albert Blvd
- 608 Lorella Ave
- 537 Lorella Ave