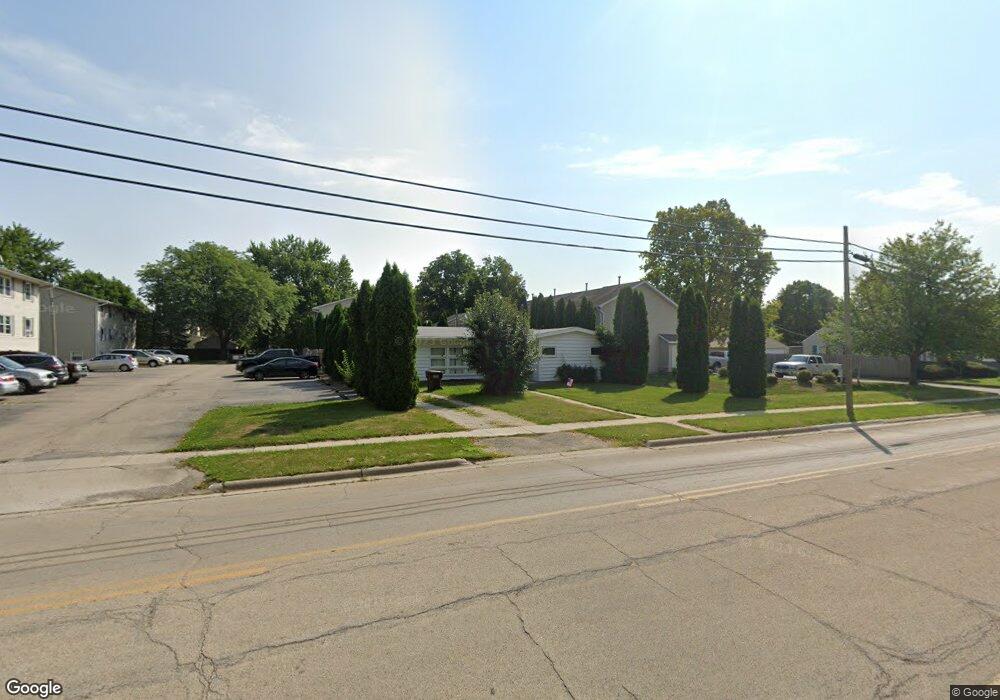
549 S Main St Rochelle, IL 61068
Estimated Value: $106,000 - $133,204
3
Beds
1
Bath
1,142
Sq Ft
$107/Sq Ft
Est. Value
About This Home
This home is located at 549 S Main St, Rochelle, IL 61068 and is currently estimated at $122,051, approximately $106 per square foot. 549 S Main St is a home located in Ogle County with nearby schools including Rochelle Township High School and St. Paul Lutheran School.
Ownership History
Date
Name
Owned For
Owner Type
Purchase Details
Closed on
Sep 20, 2011
Sold by
Fannie Mae
Bought by
Seldal Properties Llc
Current Estimated Value
Home Financials for this Owner
Home Financials are based on the most recent Mortgage that was taken out on this home.
Original Mortgage
$44,000
Outstanding Balance
$30,088
Interest Rate
4.23%
Mortgage Type
Commercial
Estimated Equity
$91,963
Purchase Details
Closed on
Jun 5, 2011
Sold by
Hanson Gerald E and Hanson Linda L
Bought by
Federal National Mortgage Association
Purchase Details
Closed on
Oct 1, 2005
Sold by
Overbay Vicki A and Overbay Loren L
Bought by
Thanson Gerald E and Rowton Linda O
Home Financials for this Owner
Home Financials are based on the most recent Mortgage that was taken out on this home.
Original Mortgage
$94,500
Interest Rate
5.83%
Mortgage Type
New Conventional
Create a Home Valuation Report for This Property
The Home Valuation Report is an in-depth analysis detailing your home's value as well as a comparison with similar homes in the area
Home Values in the Area
Average Home Value in this Area
Purchase History
| Date | Buyer | Sale Price | Title Company |
|---|---|---|---|
| Seldal Properties Llc | $50,000 | Central Illinois Title Compa | |
| Federal National Mortgage Association | $104,414 | None Available | |
| Thanson Gerald E | $94,000 | None Available |
Source: Public Records
Mortgage History
| Date | Status | Borrower | Loan Amount |
|---|---|---|---|
| Open | Seldal Properties Llc | $44,000 | |
| Previous Owner | Thanson Gerald E | $94,500 |
Source: Public Records
Tax History Compared to Growth
Tax History
| Year | Tax Paid | Tax Assessment Tax Assessment Total Assessment is a certain percentage of the fair market value that is determined by local assessors to be the total taxable value of land and additions on the property. | Land | Improvement |
|---|---|---|---|---|
| 2024 | $1,445 | $27,132 | $5,188 | $21,944 |
| 2023 | $2,022 | $25,392 | $4,855 | $20,537 |
| 2022 | $1,226 | $24,162 | $4,620 | $19,542 |
| 2021 | $2,140 | $22,321 | $4,268 | $18,053 |
| 2020 | $2,059 | $21,258 | $4,065 | $17,193 |
| 2019 | $2,021 | $20,892 | $3,995 | $16,897 |
| 2018 | $1,972 | $20,483 | $3,917 | $16,566 |
| 2017 | $1,945 | $20,483 | $3,917 | $16,566 |
| 2016 | $1,762 | $18,199 | $3,810 | $14,389 |
| 2015 | $1,713 | $17,894 | $3,746 | $14,148 |
| 2014 | $1,774 | $17,894 | $3,746 | $14,148 |
| 2013 | $1,291 | $18,759 | $3,927 | $14,832 |
Source: Public Records
Map
Nearby Homes
- 122 Shirley Ave
- 113 Janet Ave
- 208 Irene Ave
- 420 S 7th St
- 200 N Washington St
- 000 1st Ave
- 1002 1st Ave
- 516 N 6th St
- 1091 S 7th St
- 107 Southview Dr
- 1210 Lincoln Ave
- Lot 11 Kelley Dr
- 230 Lake Lida Ln
- 216 Lake Lida Ln
- 620 N 9th St
- 907 Carlisle Dr
- 1013 Lincoln Hwy
- 836 N 11th St
- 822 N 12th St
- 1050 Lincoln Hwy