Estimated Value: $124,000 - $184,000
3
Beds
2
Baths
1,218
Sq Ft
$127/Sq Ft
Est. Value
About This Home
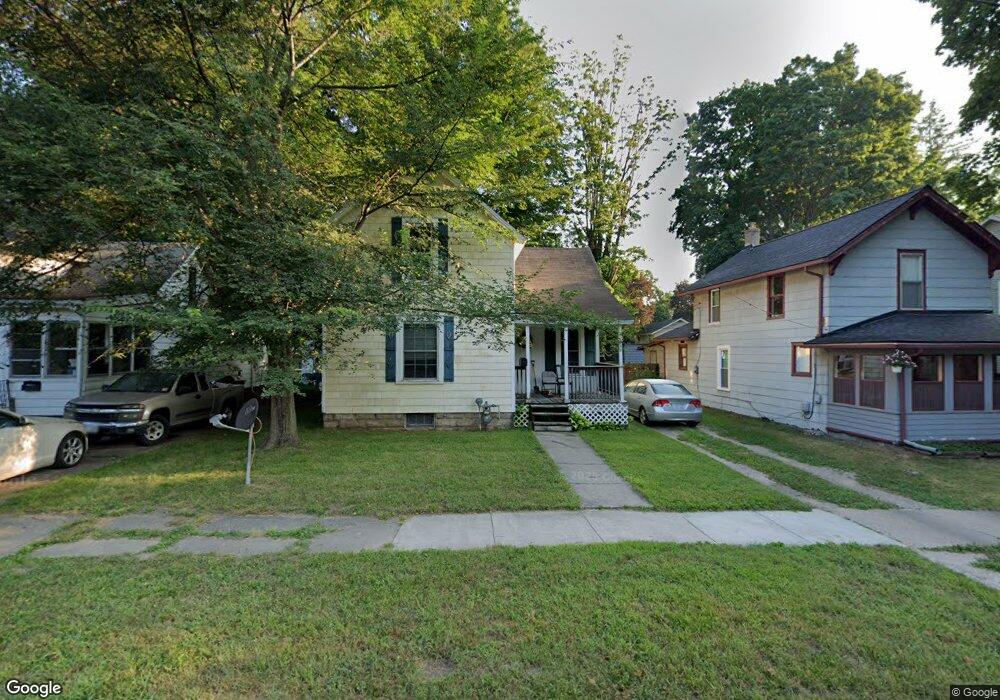
This home is located at 549 Union St, Niles, MI 49120 and is currently estimated at $155,227, approximately $127 per square foot. 549 Union St is a home located in Berrien County with nearby schools including Ballard Elementary School, Oak Manor Sixth Grade Center, and Ring Lardner Middle School.
Ownership History
Date
Name
Owned For
Owner Type
Purchase Details
Closed on
Oct 2, 2006
Sold by
U S Bank Na
Bought by
Trubac Laura Kelley
Current Estimated Value
Purchase Details
Closed on
Sep 12, 2006
Sold by
Anders Kent R and Anders Tammy J
Bought by
Trubac Laura Kelley
Home Financials for this Owner
Home Financials are based on the most recent Mortgage that was taken out on this home.
Original Mortgage
$52,800
Interest Rate
6.5%
Mortgage Type
Purchase Money Mortgage
Purchase Details
Closed on
Jul 26, 2006
Sold by
Trubac Laura Kelley
Bought by
Hein Todd Richard
Home Financials for this Owner
Home Financials are based on the most recent Mortgage that was taken out on this home.
Original Mortgage
$52,800
Interest Rate
6.5%
Mortgage Type
Purchase Money Mortgage
Purchase Details
Closed on
Aug 25, 2004
Sold by
Aliotta Brian P
Bought by
Trubac Laura Kelly
Purchase Details
Closed on
Jul 22, 2002
Purchase Details
Closed on
Nov 8, 2001
Purchase Details
Closed on
Feb 13, 1996
Purchase Details
Closed on
Jan 1, 1975
Create a Home Valuation Report for This Property
The Home Valuation Report is an in-depth analysis detailing your home's value as well as a comparison with similar homes in the area
Home Values in the Area
Average Home Value in this Area
Purchase History
| Date | Buyer | Sale Price | Title Company |
|---|---|---|---|
| Trubac Laura Kelley | -- | -- | |
| Trubac Laura Kelley | -- | None Available | |
| Hein Todd Richard | $45,000 | -- | |
| Trubac Laura Kelly | -- | -- | |
| -- | $38,000 | -- | |
| -- | $47,700 | -- | |
| -- | $33,000 | -- | |
| -- | $6,000 | -- |
Source: Public Records
Mortgage History
| Date | Status | Borrower | Loan Amount |
|---|---|---|---|
| Previous Owner | Hein Todd Richard | $52,800 |
Source: Public Records
Tax History Compared to Growth
Tax History
| Year | Tax Paid | Tax Assessment Tax Assessment Total Assessment is a certain percentage of the fair market value that is determined by local assessors to be the total taxable value of land and additions on the property. | Land | Improvement |
|---|---|---|---|---|
| 2025 | $1,991 | $51,600 | $0 | $0 |
| 2024 | $1,055 | $47,900 | $0 | $0 |
| 2023 | $1,011 | $41,400 | $0 | $0 |
| 2022 | $963 | $45,900 | $0 | $0 |
| 2021 | $1,749 | $40,100 | $3,300 | $36,800 |
| 2020 | $1,729 | $40,500 | $0 | $0 |
| 2019 | $1,704 | $33,900 | $1,500 | $32,400 |
| 2018 | $1,642 | $33,900 | $0 | $0 |
| 2017 | $1,623 | $28,800 | $0 | $0 |
| 2016 | $1,781 | $31,900 | $0 | $0 |
| 2015 | $1,860 | $33,600 | $0 | $0 |
| 2014 | $980 | $33,400 | $0 | $0 |
Source: Public Records
Map
Nearby Homes