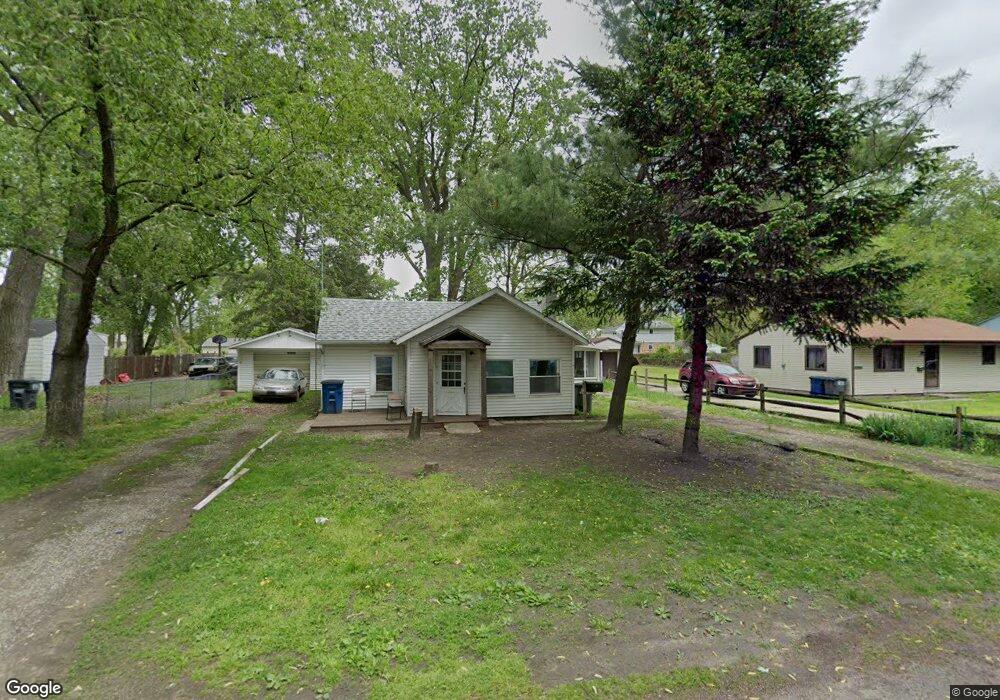
549 Weston St Toledo, OH 43609
Southside NeighborhoodEstimated Value: $75,000 - $94,000
3
Beds
1
Bath
916
Sq Ft
$88/Sq Ft
Est. Value
About This Home
This home is located at 549 Weston St, Toledo, OH 43609 and is currently estimated at $81,010, approximately $88 per square foot. 549 Weston St is a home located in Lucas County with nearby schools including Reynolds Elementary School, Rogers High School, and Toledo Preparatory and Fitness Academy.
Ownership History
Date
Name
Owned For
Owner Type
Purchase Details
Closed on
Feb 23, 2024
Sold by
Frazier Sonya Jean
Bought by
Fafard Justin M
Current Estimated Value
Purchase Details
Closed on
Feb 8, 2024
Sold by
Dittmer Donald A
Bought by
Frazier Sonya Jean
Purchase Details
Closed on
Feb 21, 2019
Sold by
Kyles Terrance R
Bought by
Kyles Terrance
Purchase Details
Closed on
Dec 17, 2018
Sold by
Kyles Terrance
Bought by
Kyles Terrance Rq
Purchase Details
Closed on
Oct 9, 2018
Sold by
Bressan Donna
Bought by
Kyles Terrance
Home Financials for this Owner
Home Financials are based on the most recent Mortgage that was taken out on this home.
Original Mortgage
$7,500
Interest Rate
5%
Mortgage Type
Purchase Money Mortgage
Purchase Details
Closed on
Aug 17, 2015
Sold by
Dittmer Donald A
Bought by
Bressan Donna
Create a Home Valuation Report for This Property
The Home Valuation Report is an in-depth analysis detailing your home's value as well as a comparison with similar homes in the area
Home Values in the Area
Average Home Value in this Area
Purchase History
| Date | Buyer | Sale Price | Title Company |
|---|---|---|---|
| Fafard Justin M | $23,000 | None Listed On Document | |
| Frazier Sonya Jean | -- | None Listed On Document | |
| Kyles Terrance | -- | None Available | |
| Kyles Terrance Rq | -- | None Available | |
| Kyles Terrance | $12,500 | None Available | |
| Bressan Donna | -- | None Available |
Source: Public Records
Mortgage History
| Date | Status | Borrower | Loan Amount |
|---|---|---|---|
| Previous Owner | Kyles Terrance | $7,500 |
Source: Public Records
Tax History Compared to Growth
Tax History
| Year | Tax Paid | Tax Assessment Tax Assessment Total Assessment is a certain percentage of the fair market value that is determined by local assessors to be the total taxable value of land and additions on the property. | Land | Improvement |
|---|---|---|---|---|
| 2024 | $1,760 | $17,185 | $5,320 | $11,865 |
| 2023 | $889 | $8,610 | $5,670 | $2,940 |
| 2022 | $752 | $8,610 | $5,670 | $2,940 |
| 2021 | $276 | $8,610 | $5,670 | $2,940 |
| 2020 | $320 | $7,175 | $4,725 | $2,450 |
| 2019 | $287 | $7,175 | $4,725 | $2,450 |
| 2018 | $547 | $7,175 | $4,725 | $2,450 |
| 2017 | $450 | $11,900 | $4,375 | $7,525 |
| 2016 | $484 | $34,000 | $12,500 | $21,500 |
| 2015 | $797 | $34,000 | $12,500 | $21,500 |
| 2014 | $201 | $11,910 | $4,380 | $7,530 |
| 2013 | $201 | $11,910 | $4,380 | $7,530 |
Source: Public Records
Map
Nearby Homes
- 560 Williamsville Ave
- 638 Foredale Ave
- 728 Foredale Ave
- 546 Elmdale Rd
- 707 Brysen Ave
- 2828 South Ave
- 725 S Westwood Ave
- 710 Durango Dr
- 576 Bronx Dr
- 1302 E Beverly Hills Dr
- 3546 Denise Dr
- 4132 Redondo Ave
- 326 Independence Rd
- 556 Apple Ave
- 1351 Bensch Dr
- 615 Cuthbert Rd
- 642 MacKow Dr
- 710 N Byrne Rd
- 4347 Merry Ln
- 620 Broer Ave