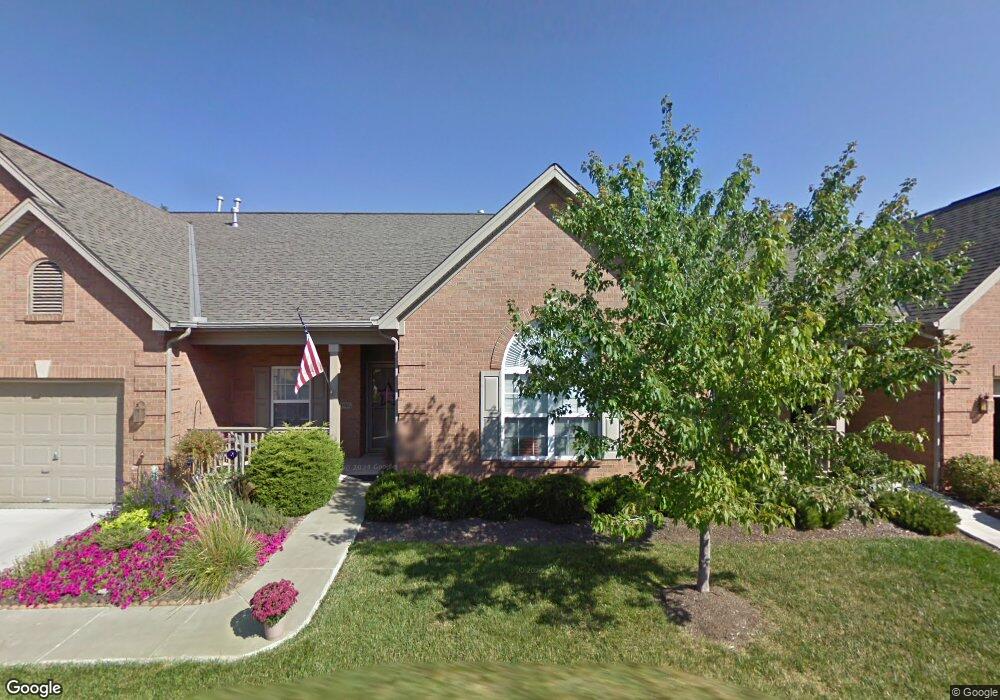
5490 Harbourside Dr Unit 103 Mason, OH 45040
Deerfield Township NeighborhoodEstimated Value: $279,000 - $343,000
2
Beds
2
Baths
1,350
Sq Ft
$231/Sq Ft
Est. Value
About This Home
This home is located at 5490 Harbourside Dr Unit 103, Mason, OH 45040 and is currently estimated at $311,629, approximately $230 per square foot. 5490 Harbourside Dr Unit 103 is a home located in Warren County with nearby schools including Mason Intermediate Elementary School, Mason Middle School, and William Mason High School.
Ownership History
Date
Name
Owned For
Owner Type
Purchase Details
Closed on
Aug 23, 2013
Sold by
Byers Jill
Bought by
Moore Mary Ann and The Moore Family Trust
Current Estimated Value
Home Financials for this Owner
Home Financials are based on the most recent Mortgage that was taken out on this home.
Original Mortgage
$128,600
Outstanding Balance
$95,252
Interest Rate
4.29%
Mortgage Type
Future Advance Clause Open End Mortgage
Estimated Equity
$216,377
Purchase Details
Closed on
Jul 31, 2008
Sold by
Thomas Brian C
Bought by
Byers Jill
Purchase Details
Closed on
Sep 6, 2001
Sold by
Harbour Watch Llc
Bought by
Thomas Brian C
Home Financials for this Owner
Home Financials are based on the most recent Mortgage that was taken out on this home.
Original Mortgage
$154,280
Interest Rate
7.03%
Mortgage Type
New Conventional
Create a Home Valuation Report for This Property
The Home Valuation Report is an in-depth analysis detailing your home's value as well as a comparison with similar homes in the area
Home Values in the Area
Average Home Value in this Area
Purchase History
| Date | Buyer | Sale Price | Title Company |
|---|---|---|---|
| Moore Mary Ann | $171,500 | Pruminent Title Agency | |
| Byers Jill | $160,900 | Stonebridge Land Title | |
| Thomas Brian C | $162,400 | -- |
Source: Public Records
Mortgage History
| Date | Status | Borrower | Loan Amount |
|---|---|---|---|
| Open | Moore Mary Ann | $128,600 | |
| Previous Owner | Thomas Brian C | $154,280 |
Source: Public Records
Tax History Compared to Growth
Tax History
| Year | Tax Paid | Tax Assessment Tax Assessment Total Assessment is a certain percentage of the fair market value that is determined by local assessors to be the total taxable value of land and additions on the property. | Land | Improvement |
|---|---|---|---|---|
| 2024 | $3,438 | $90,620 | $21,000 | $69,620 |
| 2023 | $3,125 | $70,371 | $8,610 | $61,761 |
| 2022 | $3,125 | $70,371 | $8,610 | $61,761 |
| 2021 | $2,971 | $70,371 | $8,610 | $61,761 |
| 2020 | $2,752 | $57,211 | $7,000 | $50,211 |
| 2019 | $2,549 | $57,211 | $7,000 | $50,211 |
| 2018 | $2,559 | $57,211 | $7,000 | $50,211 |
| 2017 | $2,410 | $50,859 | $6,332 | $44,527 |
| 2016 | $2,478 | $50,859 | $6,332 | $44,527 |
| 2015 | $2,484 | $50,859 | $6,332 | $44,527 |
| 2014 | $2,478 | $47,530 | $5,920 | $41,620 |
| 2013 | $3,043 | $56,220 | $7,000 | $49,220 |
Source: Public Records
Map
Nearby Homes
- 5626 Baywatch Way
- 5661 Baywatch Way
- 7693 Misty Springs Ct
- 7648 Waterfront Way
- 7660 Waterfront Way
- 7692 Waterfront Way
- 7600 Waterfront Way
- 5339 Mapledale Way
- 7725 Livingston Dr
- 8421 Cameron Ct
- 5369 N Shore Place
- 8659 Coveview Ct
- 7858 Yellowwood Dr
- 4765 Mallard Creek Dr
- 6266 Trailwood Ct
- 5532 Winding Cape Way
- 5641 Melbury Ct
- 7911 Meadowbrook Dr
- 7839 Meadowbrook Dr
- 7531 Kousa Ct
- 5490 Harbourside Dr Unit 103
- 5490 Harbourside Dr
- 5496 Harbourside Dr
- 5486 Harbourside Dr
- 5486 Harbourside Dr Unit 104
- 5500 Harbourside Dr Unit 101
- 5500 Harbourside Dr Unit 101
- 5500 Harbourside Dr
- 5462 Harbourside Dr Unit 103
- 5462 Harbourside Dr Unit 16101
- 5462 Harbourside Dr
- 5509 Harbourside Dr Unit 101
- 5509 Harbourside Dr Unit 33101
- 5509 Harbourside Dr
- 5473 Harbourside Dr
- 5473 Harbourside Dr
- 5477 Harbourside Dr
- 5477 Harbourside Dr
- 5469 Harbourside Dr
- 5469 Harbourside Dr