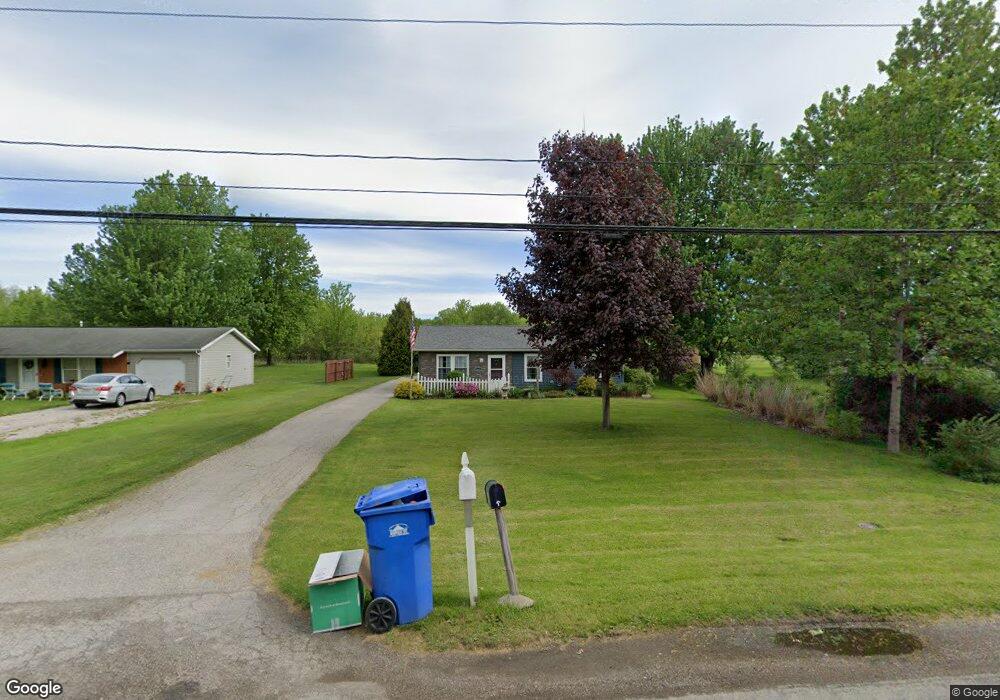
5491 W Maple Rd Geneva, OH 44041
Geneva NeighborhoodEstimated Value: $115,000 - $245,000
3
Beds
2
Baths
1,120
Sq Ft
$166/Sq Ft
Est. Value
About This Home
This home is located at 5491 W Maple Rd, Geneva, OH 44041 and is currently estimated at $185,467, approximately $165 per square foot. 5491 W Maple Rd is a home located in Ashtabula County with nearby schools including Geneva Middle School, Geneva High School, and Assumption School.
Ownership History
Date
Name
Owned For
Owner Type
Purchase Details
Closed on
Jun 6, 2014
Sold by
Ryan Robert F
Bought by
Hosler Nadine G and Ryan Nadine G
Current Estimated Value
Purchase Details
Closed on
Nov 3, 2005
Sold by
Ryan Nadine G and Ryan Robert F
Bought by
Ryan Robert F and Ryan Nadine G
Home Financials for this Owner
Home Financials are based on the most recent Mortgage that was taken out on this home.
Original Mortgage
$89,573
Outstanding Balance
$48,899
Interest Rate
5.98%
Mortgage Type
FHA
Estimated Equity
$136,569
Purchase Details
Closed on
Aug 29, 1994
Sold by
Pac Homes Inc
Bought by
Hayes David L and Hayes Nadine G
Home Financials for this Owner
Home Financials are based on the most recent Mortgage that was taken out on this home.
Original Mortgage
$71,500
Interest Rate
8%
Mortgage Type
New Conventional
Create a Home Valuation Report for This Property
The Home Valuation Report is an in-depth analysis detailing your home's value as well as a comparison with similar homes in the area
Home Values in the Area
Average Home Value in this Area
Purchase History
| Date | Buyer | Sale Price | Title Company |
|---|---|---|---|
| Hosler Nadine G | -- | Chicago Title Agency | |
| Ryan Robert F | -- | Firstmerit Title | |
| Hayes David L | $71,500 | -- |
Source: Public Records
Mortgage History
| Date | Status | Borrower | Loan Amount |
|---|---|---|---|
| Open | Ryan Robert F | $89,573 | |
| Closed | Hayes David L | $71,500 |
Source: Public Records
Tax History
| Year | Tax Paid | Tax Assessment Tax Assessment Total Assessment is a certain percentage of the fair market value that is determined by local assessors to be the total taxable value of land and additions on the property. | Land | Improvement |
|---|---|---|---|---|
| 2024 | $3,645 | $43,900 | $6,060 | $37,840 |
| 2023 | $1,995 | $43,900 | $6,060 | $37,840 |
| 2022 | $1,621 | $32,700 | $4,660 | $28,040 |
| 2021 | $1,620 | $32,700 | $4,660 | $28,040 |
| 2020 | $1,620 | $32,700 | $4,660 | $28,040 |
| 2019 | $1,535 | $30,070 | $5,360 | $24,710 |
| 2018 | $1,451 | $30,070 | $5,360 | $24,710 |
| 2017 | $1,444 | $30,070 | $5,360 | $24,710 |
| 2016 | $1,439 | $29,820 | $5,320 | $24,500 |
| 2015 | $2,856 | $29,820 | $5,320 | $24,500 |
| 2014 | $1,388 | $29,820 | $5,320 | $24,500 |
| 2013 | $1,399 | $31,260 | $5,040 | $26,220 |
Source: Public Records
Map
Nearby Homes
- 3583 Austin Rd
- 3583 Austin Rd Unit 89
- 3583 Austin Rd Unit 5
- 3583 Austin Rd Unit 102
- 107 North Ave
- 229 Elm St
- 3764 Padanarum Rd
- 234 Elm St
- 215 Woodlawn Ave
- 549 E Main St
- VL N Crowell Ave
- 45 S Cedar St
- 350 Morrison St
- 206 S Eagle St
- 5162 Woodside Dr
- 254 S Eagle St
- 729 W Main St
- 3449 Addison Rd
- 4165 Wheeler Creek Rd
- 171 Leslie St
- 5473 W Maple Rd
- 5501 W Maple Rd
- 5513 W Maple Rd
- 5463 W Maple Rd
- 5542 W Maple Rd
- 5453 W Maple Rd
- 5523 W Maple Rd
- 5544 W Maple Rd
- 5535 W Maple Rd
- 5472 W Maple Rd
- 5443 W Maple Rd
- 5560 W Maple Rd
- 5458 W Maple Rd
- 5446 W Maple Rd
- 5437 W Maple Rd
- 5434 W Maple Rd
- 5555 W Maple Rd
- 5565 W Maple Rd
- 5413 W Maple Rd
- 5572 W Maple Rd
Your Personal Tour Guide
Ask me questions while you tour the home.