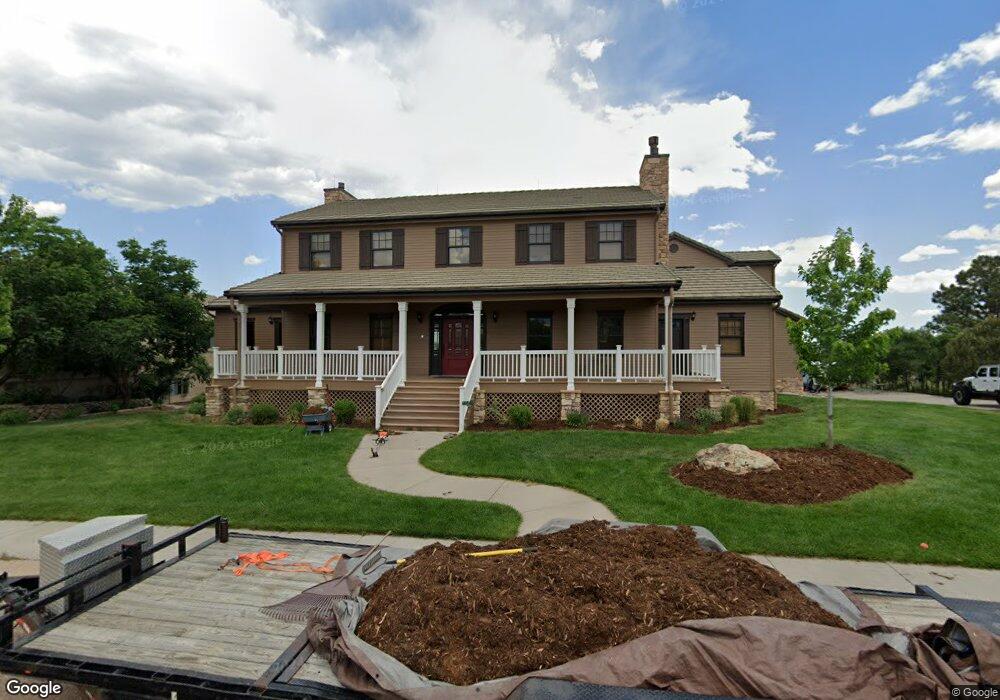
5495 Creighton Ct Colorado Springs, CO 80918
Pulpit Rock NeighborhoodEstimated Value: $1,074,688 - $1,377,000
4
Beds
6
Baths
4,083
Sq Ft
$306/Sq Ft
Est. Value
About This Home
This home is located at 5495 Creighton Ct, Colorado Springs, CO 80918 and is currently estimated at $1,249,922, approximately $306 per square foot. 5495 Creighton Ct is a home located in El Paso County with nearby schools including Fremont Elementary School, Russell Middle School, and Coronado High School.
Ownership History
Date
Name
Owned For
Owner Type
Purchase Details
Closed on
May 10, 2013
Sold by
Linder John O and Linder Bonnie T
Bought by
Estares Israel J and Estares Anne W
Current Estimated Value
Home Financials for this Owner
Home Financials are based on the most recent Mortgage that was taken out on this home.
Original Mortgage
$639,350
Outstanding Balance
$454,673
Interest Rate
3.56%
Mortgage Type
New Conventional
Estimated Equity
$795,249
Purchase Details
Closed on
Jul 7, 2010
Sold by
The Bank Of New York Mellon
Bought by
Linder John O and Linder Bonnie T
Purchase Details
Closed on
Apr 1, 2010
Sold by
Cox Richard L and Cox Carol M
Bought by
The Bank Of New York Mellon and The Bank Of New York
Purchase Details
Closed on
Feb 29, 2000
Sold by
Up Phase 1 Llc
Bought by
Cox Richard L and Cox Carol M
Home Financials for this Owner
Home Financials are based on the most recent Mortgage that was taken out on this home.
Original Mortgage
$88,410
Interest Rate
8.31%
Create a Home Valuation Report for This Property
The Home Valuation Report is an in-depth analysis detailing your home's value as well as a comparison with similar homes in the area
Home Values in the Area
Average Home Value in this Area
Purchase History
| Date | Buyer | Sale Price | Title Company |
|---|---|---|---|
| Estares Israel J | $673,000 | Fidelity National Title Insu | |
| Linder John O | $599,900 | North American Title | |
| The Bank Of New York Mellon | -- | None Available | |
| Cox Richard L | $125,000 | Land Title |
Source: Public Records
Mortgage History
| Date | Status | Borrower | Loan Amount |
|---|---|---|---|
| Open | Estares Israel J | $639,350 | |
| Previous Owner | Cox Richard L | $88,410 |
Source: Public Records
Tax History Compared to Growth
Tax History
| Year | Tax Paid | Tax Assessment Tax Assessment Total Assessment is a certain percentage of the fair market value that is determined by local assessors to be the total taxable value of land and additions on the property. | Land | Improvement |
|---|---|---|---|---|
| 2025 | $3,961 | $78,280 | -- | -- |
| 2024 | $3,821 | $75,870 | $7,130 | $68,740 |
| 2023 | $3,821 | $75,870 | $7,130 | $68,740 |
| 2022 | $3,974 | $71,010 | $6,310 | $64,700 |
| 2021 | $4,311 | $73,060 | $6,490 | $66,570 |
| 2020 | $3,814 | $56,200 | $6,490 | $49,710 |
| 2019 | $3,794 | $56,200 | $6,490 | $49,710 |
| 2018 | $3,194 | $43,530 | $5,470 | $38,060 |
| 2017 | $3,025 | $43,530 | $5,470 | $38,060 |
| 2016 | $2,691 | $46,410 | $5,730 | $40,680 |
| 2015 | $2,680 | $46,410 | $5,730 | $40,680 |
| 2014 | $2,634 | $43,780 | $5,730 | $38,050 |
Source: Public Records
Map
Nearby Homes
- 1420 Rockhurst Blvd
- 1635 Rockhurst Blvd
- 5514 Saxon Ln
- 5536 Sonnet Heights
- 1914 Erin Loop
- 1918 Erin Loop
- 5880 Cliffside Terrace
- 1920 Erin Loop
- 1860 Erin Loop
- 1858 Erin Loop
- 1926 Erin Loop
- 1928 Erin Loop
- 1930 Erin Loop
- 1932 Erin Loop
- 1934 Erin Loop
- 1936 Erin Loop
- 5810 Spurwood Ct
- 5555 Denmark Ct
- 5502 Mansfield Ct
- 5925 - 5943 University Village View
- 5505 Creighton Ct
- 5485 Creighton Ct
- 5475 Creighton Ct
- 5490 Creighton Ct
- 5470 Creighton Ct
- 1425 Rockhurst Blvd
- 5450 Creighton Ct
- 5510 Creighton Ct
- 5435 Creighton Ct
- 5430 Creighton Ct
- 1445 Rockhurst Blvd
- 5530 Creighton Ct
- 5455 Creighton Ct
- 1440 Rockhurst Blvd
- 5415 Creighton Ct
- 1465 Rockhurst Blvd
- 5550 Creighton Ct
- 1460 Rockhurst Blvd
- 5555 Creighton Ct
- 5515 Butler Ct