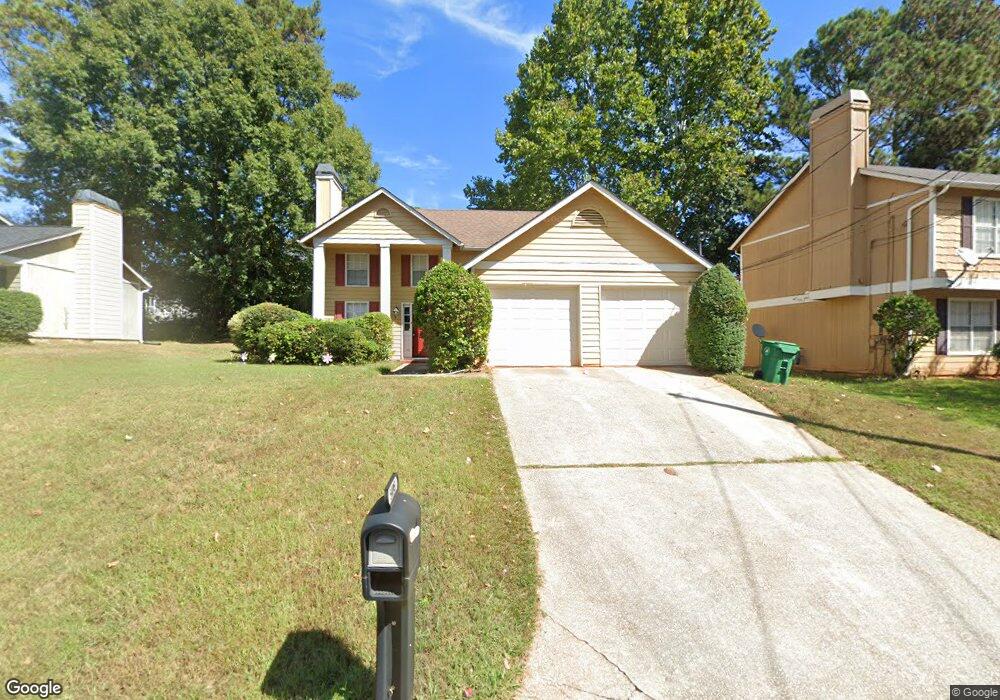
5495 Downs Way Unit 1 Lithonia, GA 30058
Estimated Value: $249,000 - $287,000
4
Beds
3
Baths
1,848
Sq Ft
$146/Sq Ft
Est. Value
About This Home
This home is located at 5495 Downs Way Unit 1, Lithonia, GA 30058 and is currently estimated at $269,298, approximately $145 per square foot. 5495 Downs Way Unit 1 is a home located in DeKalb County with nearby schools including Panola Way Elementary School, Miller Grove Middle School, and Miller Grove High School.
Ownership History
Date
Name
Owned For
Owner Type
Purchase Details
Closed on
Apr 22, 2022
Sold by
Offerpad Spe Borrower A Llc
Bought by
Segavepo 2 Llc
Current Estimated Value
Purchase Details
Closed on
Mar 28, 2022
Sold by
Kady Tiffany C
Bought by
Offerpad Spe Borrower A Llc
Purchase Details
Closed on
Jan 15, 2003
Sold by
Foster Martha
Bought by
Kady Tiffany C
Home Financials for this Owner
Home Financials are based on the most recent Mortgage that was taken out on this home.
Original Mortgage
$119,161
Interest Rate
5.89%
Mortgage Type
FHA
Purchase Details
Closed on
Jul 10, 1998
Sold by
Porter Cynthia
Bought by
Foster Martha
Home Financials for this Owner
Home Financials are based on the most recent Mortgage that was taken out on this home.
Original Mortgage
$94,479
Interest Rate
7.02%
Mortgage Type
FHA
Purchase Details
Closed on
Jul 15, 1993
Sold by
Hunter Michael A and Hunter Karen N
Bought by
Porter Cynthia
Home Financials for this Owner
Home Financials are based on the most recent Mortgage that was taken out on this home.
Original Mortgage
$74,250
Interest Rate
7.49%
Mortgage Type
FHA
Create a Home Valuation Report for This Property
The Home Valuation Report is an in-depth analysis detailing your home's value as well as a comparison with similar homes in the area
Home Values in the Area
Average Home Value in this Area
Purchase History
| Date | Buyer | Sale Price | Title Company |
|---|---|---|---|
| Segavepo 2 Llc | $275,000 | -- | |
| Offerpad Spe Borrower A Llc | $265,000 | -- | |
| Kady Tiffany C | $120,200 | -- | |
| Foster Martha | $95,900 | -- | |
| Porter Cynthia | $9,500 | -- |
Source: Public Records
Mortgage History
| Date | Status | Borrower | Loan Amount |
|---|---|---|---|
| Previous Owner | Kady Tiffany C | $119,161 | |
| Previous Owner | Foster Martha | $94,479 | |
| Previous Owner | Porter Cynthia | $74,250 |
Source: Public Records
Tax History
| Year | Tax Paid | Tax Assessment Tax Assessment Total Assessment is a certain percentage of the fair market value that is determined by local assessors to be the total taxable value of land and additions on the property. | Land | Improvement |
|---|---|---|---|---|
| 2025 | $5,429 | $114,000 | $14,820 | $99,180 |
| 2024 | $5,799 | $122,480 | $16,000 | $106,480 |
| 2023 | $5,799 | $121,320 | $16,000 | $105,320 |
Source: Public Records
Map
Nearby Homes
- 5477 Forest Pines Dr
- 5456 Forest Pines Dr
- 5570 Downs Way
- 5571 Panola Place
- 2026 Mallard Crest
- 5427 Forest Pines Dr
- 2123 Panola Rd
- 5595 Marbut Rd
- 2469 Briar Knoll Rd
- 5490 Marbut Rd
- 2438 Briar Knoll Rd
- 5445 Mallard Trail Unit 1
- 2169 Panola Rd
- 2420 Briar Knoll Rd
- 5333 Olde St
- 1900 Panola Rd
- 1841 Northwick Place
- 5358 Brooklands Dr
- 5570 Cannonade Ln
- 1914 Taffeta Trail
- 5501 Downs Way Unit 1
- 5489 Downs Way
- 5500 Panola Downs Rd
- 5503 Panola Place Unit 2
- 5497 Panola Place
- 5504 Panola Downs Rd
- 5483 Downs Way
- 5496 Panola Downs Rd
- 5494 Downs Way
- 5500 Downs Way
- 5507 Panola Place
- 5490 Downs Way
- 5486 Downs Way Unit 1
- 5504 Downs Way
- 5490 Panola Downs Rd
- 5506 Panola Downs Rd
- 5513 Panola Place
- 5513 Panola Place Unit 32
- 5508 Downs Way
- 5482 Downs Way
Your Personal Tour Guide
Ask me questions while you tour the home.