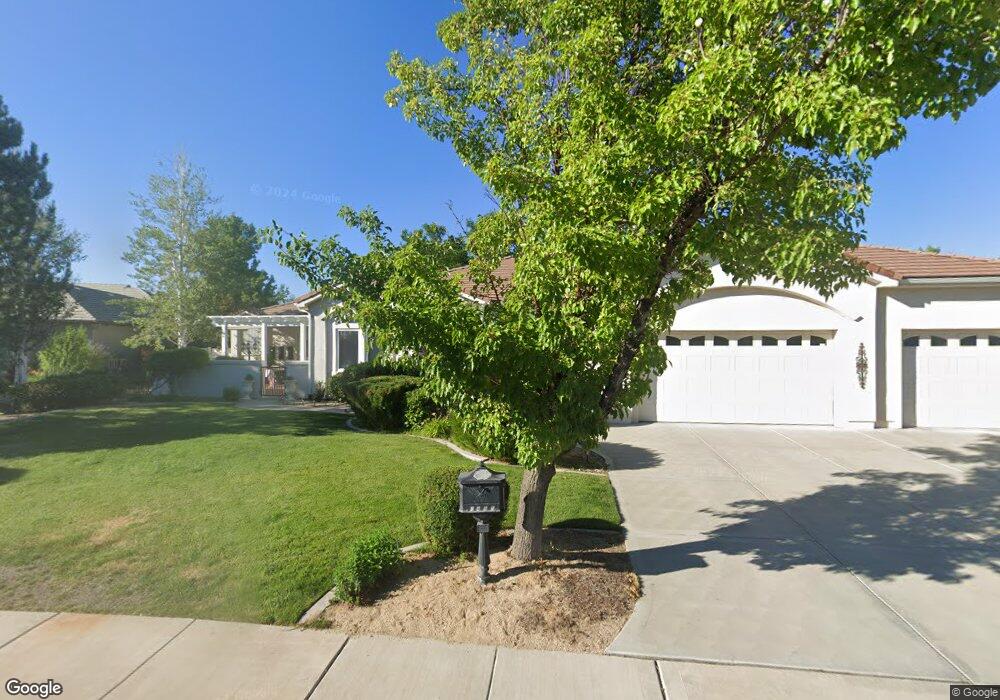
5495 Hidden Green Point Reno, NV 89502
Hidden Valley NeighborhoodEstimated Value: $994,000 - $1,296,000
4
Beds
4
Baths
3,131
Sq Ft
$354/Sq Ft
Est. Value
About This Home
This home is located at 5495 Hidden Green Point, Reno, NV 89502 and is currently estimated at $1,107,315, approximately $353 per square foot. 5495 Hidden Green Point is a home located in Washoe County with nearby schools including Hidden Valley Elementary School, Edward L Pine Middle School, and Earl Wooster High School.
Ownership History
Date
Name
Owned For
Owner Type
Purchase Details
Closed on
Jun 7, 2017
Sold by
Ross Robert H and Ross Lois M
Bought by
Ross Robert M and Ross Patricia A
Current Estimated Value
Purchase Details
Closed on
Jul 16, 2012
Sold by
Langowski Odo and Langowski Christina
Bought by
Ross Robert H and Ross Lois M
Home Financials for this Owner
Home Financials are based on the most recent Mortgage that was taken out on this home.
Original Mortgage
$405,000
Outstanding Balance
$279,962
Interest Rate
3.7%
Mortgage Type
VA
Estimated Equity
$827,353
Purchase Details
Closed on
Sep 5, 2004
Sold by
Network Investments Llc
Bought by
Langowski Odo and Langowski Christina
Home Financials for this Owner
Home Financials are based on the most recent Mortgage that was taken out on this home.
Original Mortgage
$500,000
Interest Rate
4.12%
Mortgage Type
Construction
Purchase Details
Closed on
Jul 13, 2004
Sold by
Montgomery Development Llc
Bought by
Network Investments Llc
Home Financials for this Owner
Home Financials are based on the most recent Mortgage that was taken out on this home.
Original Mortgage
$500,000
Interest Rate
4.12%
Mortgage Type
Construction
Purchase Details
Closed on
Jul 11, 2003
Sold by
Montgomery Development Llc
Bought by
Network Investments Llc
Create a Home Valuation Report for This Property
The Home Valuation Report is an in-depth analysis detailing your home's value as well as a comparison with similar homes in the area
Home Values in the Area
Average Home Value in this Area
Purchase History
| Date | Buyer | Sale Price | Title Company |
|---|---|---|---|
| Ross Robert M | -- | First Centennial Reno | |
| Ross Robert H | $450,000 | None Available | |
| Langowski Odo | $100,000 | First American Title | |
| Network Investments Llc | $30,000 | -- | |
| Network Investments Llc | $30,000 | -- |
Source: Public Records
Mortgage History
| Date | Status | Borrower | Loan Amount |
|---|---|---|---|
| Open | Ross Robert H | $405,000 | |
| Previous Owner | Langowski Odo | $500,000 |
Source: Public Records
Tax History Compared to Growth
Tax History
| Year | Tax Paid | Tax Assessment Tax Assessment Total Assessment is a certain percentage of the fair market value that is determined by local assessors to be the total taxable value of land and additions on the property. | Land | Improvement |
|---|---|---|---|---|
| 2025 | $6,176 | $260,531 | $55,125 | $205,406 |
| 2024 | $6,176 | $257,741 | $51,566 | $206,175 |
| 2023 | $5,999 | $246,746 | $51,566 | $195,181 |
| 2022 | $5,826 | $203,134 | $40,383 | $162,751 |
| 2021 | $5,656 | $194,487 | $32,666 | $161,821 |
| 2020 | $5,490 | $194,637 | $32,666 | $161,971 |
| 2019 | $5,330 | $182,492 | $26,040 | $156,452 |
| 2018 | $5,174 | $171,323 | $18,200 | $153,123 |
| 2017 | $4,934 | $170,033 | $16,884 | $153,149 |
| 2016 | $4,805 | $166,182 | $17,024 | $149,158 |
| 2015 | $4,800 | $158,342 | $16,604 | $141,738 |
| 2014 | $4,754 | $143,572 | $13,720 | $129,852 |
| 2013 | -- | $125,362 | $11,984 | $113,378 |
Source: Public Records
Map
Nearby Homes
- 6815 Prestwick Cir
- 3477 E Hidden Valley Dr Unit 3
- 5409 Greenview Ct
- 5329 Mira Loma Dr
- 2915 Fairwood Dr
- 3690 Sleepy Hollow Dr
- 4841 W Hidden Valley Dr
- 5279 Mira Loma Dr
- 2835 Parkway Dr
- 3455 Craviasco Ln
- 3069 Creekwood Dr
- 5705 Blue Hills Dr
- 2265 Silky Sullivan Ln
- 3105 Fairwood Dr
- 5595 Saint Andrews Ct
- 2100 Parkway Dr
- 5675 E Hidden Valley Dr
- 5977 Hidden Highlands Dr
- 5979 Hidden Highlands Dr
- 3518 Herons Cir
- 4151 W Hidden Valley Dr
- 5485 Hidden Green Point
- 5490 Hidden Green Point
- 5490 Hidden Green Pointe
- 5475 Hidden Green Point
- 4141 W Hidden Valley Dr
- 3390 W Hidden Valley Dr
- 3350 W Hidden Valley Dr
- 5470 Hidden Green Point
- 3470 W Hidden Valley Dr
- 5465 Hidden Green Point
- 3310 W Hidden Valley Dr
- 5455 Hidden Green Point
- 3550 W Hidden Valley Dr
- 5460 Hidden Green Point
- 5450 Hidden Green Point
- 3660 W Hidden Valley Dr
- 4201 W Hidden Valley Dr
- 3690 W Hidden Valley Dr
- 3740 W Hidden Valley Dr