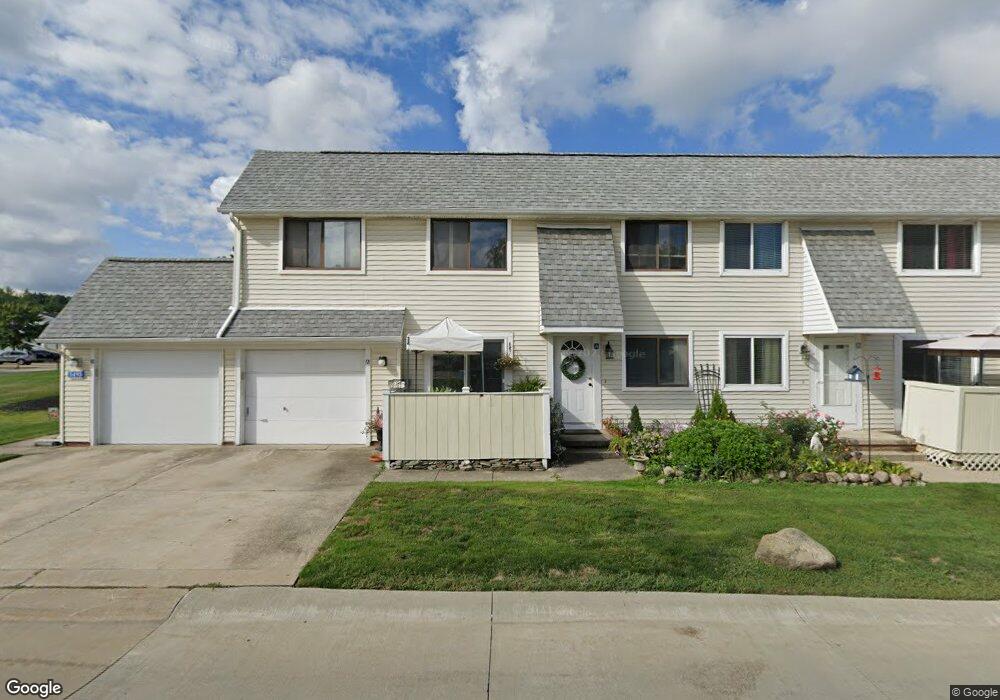
5495 Sierra Dr Unit D51 Willoughby, OH 44094
Downtown Willoughby NeighborhoodEstimated Value: $144,000 - $163,000
2
Beds
1
Bath
1,082
Sq Ft
$145/Sq Ft
Est. Value
About This Home
This home is located at 5495 Sierra Dr Unit D51, Willoughby, OH 44094 and is currently estimated at $156,373, approximately $144 per square foot. 5495 Sierra Dr Unit D51 is a home located in Lake County with nearby schools including Edison Elementary School, Willoughby Middle School, and South High School.
Ownership History
Date
Name
Owned For
Owner Type
Purchase Details
Closed on
Dec 3, 2020
Sold by
Tyree Deborah L
Bought by
Pinzarroni Michele A
Current Estimated Value
Home Financials for this Owner
Home Financials are based on the most recent Mortgage that was taken out on this home.
Original Mortgage
$73,260
Outstanding Balance
$65,340
Interest Rate
2.8%
Mortgage Type
FHA
Estimated Equity
$91,033
Purchase Details
Closed on
Jul 28, 2011
Sold by
Georgian Rita and Georgian Thomas W
Bought by
Tyree Deborah L
Home Financials for this Owner
Home Financials are based on the most recent Mortgage that was taken out on this home.
Original Mortgage
$73,098
Interest Rate
4.52%
Mortgage Type
FHA
Purchase Details
Closed on
Jun 18, 1999
Sold by
Gammiere Debra E
Bought by
Dolista Nettie and Georgian Rita
Purchase Details
Closed on
Mar 26, 1996
Sold by
Americon Inc
Bought by
Gammiere Debra E
Home Financials for this Owner
Home Financials are based on the most recent Mortgage that was taken out on this home.
Original Mortgage
$81,550
Interest Rate
7.06%
Mortgage Type
FHA
Create a Home Valuation Report for This Property
The Home Valuation Report is an in-depth analysis detailing your home's value as well as a comparison with similar homes in the area
Home Values in the Area
Average Home Value in this Area
Purchase History
| Date | Buyer | Sale Price | Title Company |
|---|---|---|---|
| Pinzarroni Michele A | $122,000 | Pathway Title Agency Llc | |
| Tyree Deborah L | $75,000 | New Market Title Llc | |
| Dolista Nettie | $102,000 | Midland Title Security Inc | |
| Gammiere Debra E | $83,500 | -- |
Source: Public Records
Mortgage History
| Date | Status | Borrower | Loan Amount |
|---|---|---|---|
| Open | Pinzarroni Michele A | $73,260 | |
| Previous Owner | Tyree Deborah L | $73,098 | |
| Previous Owner | Gammiere Debra E | $81,550 |
Source: Public Records
Tax History Compared to Growth
Tax History
| Year | Tax Paid | Tax Assessment Tax Assessment Total Assessment is a certain percentage of the fair market value that is determined by local assessors to be the total taxable value of land and additions on the property. | Land | Improvement |
|---|---|---|---|---|
| 2024 | -- | $42,740 | $13,860 | $28,880 |
| 2023 | $3,336 | $35,230 | $11,740 | $23,490 |
| 2022 | $2,184 | $35,230 | $11,740 | $23,490 |
| 2021 | $2,192 | $35,230 | $11,740 | $23,490 |
| 2020 | $2,020 | $28,890 | $9,630 | $19,260 |
| 2019 | $1,876 | $28,890 | $9,630 | $19,260 |
| 2018 | $1,865 | $27,660 | $6,620 | $21,040 |
| 2017 | $1,880 | $27,660 | $6,620 | $21,040 |
| 2016 | $1,873 | $27,660 | $6,620 | $21,040 |
| 2015 | $1,799 | $27,660 | $6,620 | $21,040 |
| 2014 | $1,707 | $27,660 | $6,620 | $21,040 |
| 2013 | $1,708 | $27,660 | $6,620 | $21,040 |
Source: Public Records
Map
Nearby Homes
- 34840 Aspen Wood Ln
- 5463 Millwood Ln Unit 42C
- 5465 Millwood Ln Unit 40-C
- 5510 Wildwood Ct Unit 81-A
- 35005 Lisle Ct
- 34615 Ethan Way
- 5785 Royal Dr
- 1705 Douglas Rd
- 5171 Jude Ct
- 5830 Ridgeview Ln
- 30811 Grant St
- 1648 Douglas Rd
- 34424 Euclid Ave Unit 122
- 0 Som Center Rd Unit 5164422
- 5549 Ericson Ln
- 5085 Shepherds Glen
- 5083 Shepherds Glen
- 5081 Shepherds Glen
- 5084 Shepherds Glen
- 1569 Douglas Rd
- 5495 Sierra Dr Unit C51
- 5495 Sierra Dr Unit B51
- 5495 Sierra Dr Unit A51
- 5495 Sierra Dr Unit D
- 5495 Sierra Dr
- 5491 Sierra Dr Unit 50-B
- 5491 Sierra Dr Unit D50
- 5491 Sierra Dr Unit C50
- 5491 Sierra Dr Unit B50
- 5491 Sierra Dr Unit A50
- 5491 Sierra Dr Unit C
- 5491 Sierra Dr Unit 50-C
- 5491 Sierra Dr Unit 50-D
- 5506 Sutton Ln Unit D17
- 5506 Sutton Ln Unit C17
- 5506 Sutton Ln Unit B17
- 5506 Sutton Ln Unit A17
- 5506 Sutton Ln Unit C
- 5506 Sutton Ln Unit 5506-B
- 5506 Sutton Ln Unit 17-C