Estimated Value: $857,000 - $1,231,000
4
Beds
2
Baths
1,320
Sq Ft
$769/Sq Ft
Est. Value
About This Home
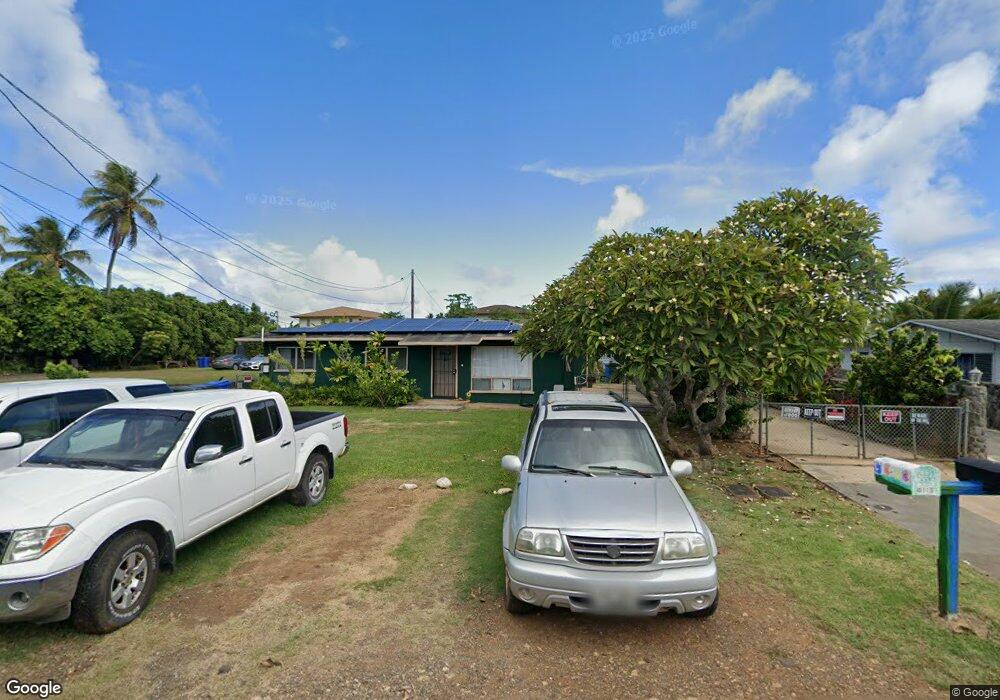
This home is located at 55-615 Naniloa Loop, Laie, HI 96762 and is currently estimated at $1,014,876, approximately $768 per square foot. 55-615 Naniloa Loop is a home located in Honolulu County with nearby schools including Laie Elementary School, Kahuku High & Intermediate School, and Asia Pacific International School.
Ownership History
Date
Name
Owned For
Owner Type
Purchase Details
Closed on
Jan 9, 2017
Sold by
Tuioti Anthony Mark and Tuioti Paula Keala
Bought by
Pili Sina and Pili Davis
Current Estimated Value
Home Financials for this Owner
Home Financials are based on the most recent Mortgage that was taken out on this home.
Original Mortgage
$554,280
Outstanding Balance
$456,777
Interest Rate
4.12%
Mortgage Type
FHA
Estimated Equity
$558,099
Purchase Details
Closed on
Oct 31, 2002
Sold by
Nihipali Paul Kealaikahikikapanookalani and Nihipali Janie Colvin
Bought by
Tuioti Anthony Mark and Tuioti Paula Keala
Home Financials for this Owner
Home Financials are based on the most recent Mortgage that was taken out on this home.
Original Mortgage
$150,000
Interest Rate
5.88%
Create a Home Valuation Report for This Property
The Home Valuation Report is an in-depth analysis detailing your home's value as well as a comparison with similar homes in the area
Home Values in the Area
Average Home Value in this Area
Purchase History
| Date | Buyer | Sale Price | Title Company |
|---|---|---|---|
| Pili Sina | $599,000 | Fhtc | |
| Pili Sina | $599,000 | Fhtc | |
| Tuioti Anthony Mark | $150,000 | -- |
Source: Public Records
Mortgage History
| Date | Status | Borrower | Loan Amount |
|---|---|---|---|
| Open | Pili Sina | $554,280 | |
| Closed | Pili Sina | $554,280 | |
| Previous Owner | Tuioti Anthony Mark | $150,000 | |
| Closed | Tuioti Anthony Mark | $4,500 |
Source: Public Records
Tax History Compared to Growth
Tax History
| Year | Tax Paid | Tax Assessment Tax Assessment Total Assessment is a certain percentage of the fair market value that is determined by local assessors to be the total taxable value of land and additions on the property. | Land | Improvement |
|---|---|---|---|---|
| 2025 | $2,749 | $908,000 | $772,500 | $135,500 |
| 2024 | $2,749 | $905,400 | $724,200 | $181,200 |
| 2023 | $2,511 | $917,400 | $724,200 | $193,200 |
| 2022 | $2,654 | $858,400 | $579,400 | $279,000 |
| 2021 | $2,432 | $794,900 | $502,100 | $292,800 |
| 2020 | $2,237 | $739,100 | $463,500 | $275,600 |
| 2019 | $2,262 | $726,400 | $482,800 | $243,600 |
| 2018 | $2,147 | $693,400 | $482,800 | $210,600 |
| 2017 | $1,913 | $546,600 | $424,900 | $121,700 |
| 2016 | $1,817 | $519,200 | $362,100 | $157,100 |
| 2015 | $1,794 | $512,700 | $362,100 | $150,600 |
| 2014 | -- | $512,200 | $362,100 | $150,100 |
Source: Public Records
Map
Nearby Homes
- 55-023 Lanihuli St
- 55-547 Moana St
- 55-610 Kamehameha Hwy Unit 3B
- 55-541 Kamehameha Hwy
- 55-439 Naniloa Loop
- 55-431 Iosepa St Unit D
- 55-497 Kamehameha Hwy Unit D
- 55-127 Naupaka St Unit B
- 55-123 Naupaka St
- 55-97 Naupaka St
- 55-371 Kamehameha Hwy Unit 55373
- 55-341 Kamehameha Hwy
- 56-201 Kamehameha Hwy
- 55-137 Kamehameha Hwy Unit B
- 55-060 & 55-064 Naupaka St
- 56-458 Kamehameha Hwy Unit 6
- 54-265 Kaipapau Loop
- 54-259 Kaipapau Loop Unit B
- 54-220 Kaipapau Loop
- 54-253 Kaipapau Loop
- 55-613 Naniloa Loop
- 55-609 Naniloa Loop
- 55-619 Naniloa Loop
- 55-623 Naniloa Loop
- 55-605 Naniloa Loop
- 55-603 Naniloa Loop Unit B
- 55-603 Naniloa Loop Unit A
- 55-618 Moana St
- 55-620 Moana St
- 55-614 Moana St
- 55 Lanihuli St
- 55-622 Moana St
- 55-612 Moana St Unit B
- 55-612 Moana St Unit A
- 55-607 Naniloa Loop Unit B
- 55-607 Naniloa Loop Unit A
- 55-601 Naniloa Loop
- 55-608 Moana St
- 55-628 Moana St
- 55-604 Moana St