
Seller's Agent in 2025
Sherry Costello
Waterfront Realty Group
(781) 799-8880
13 in this area
71 Total Sales
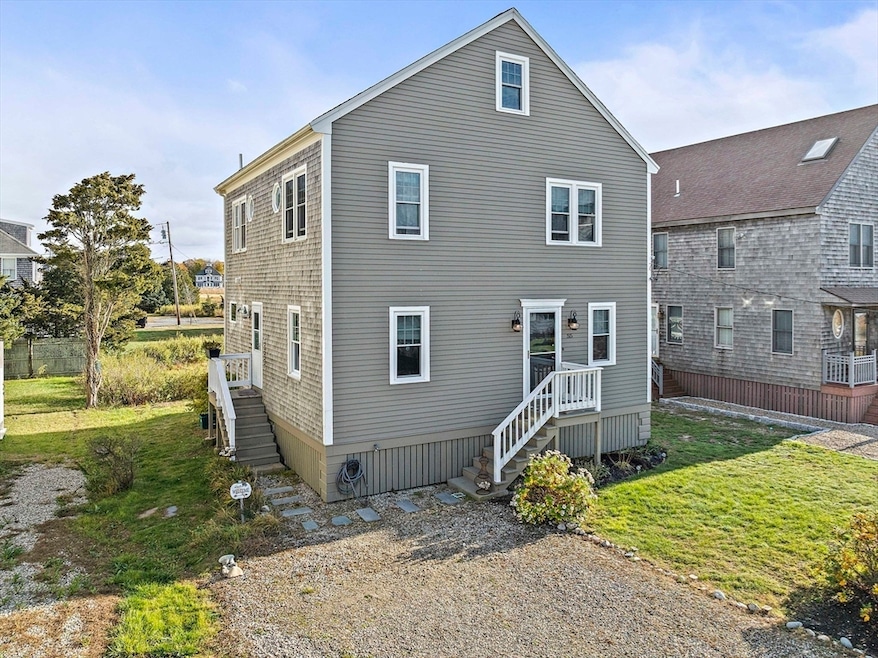
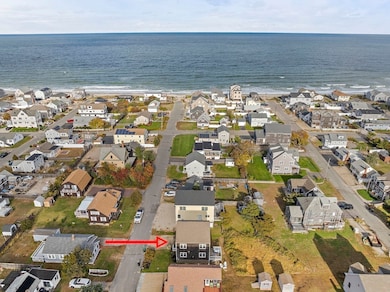
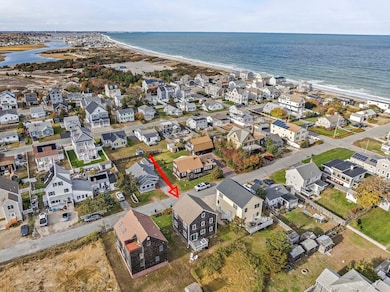
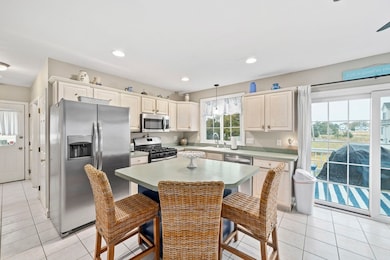
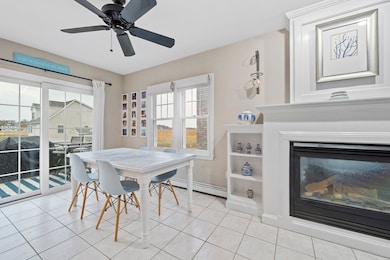
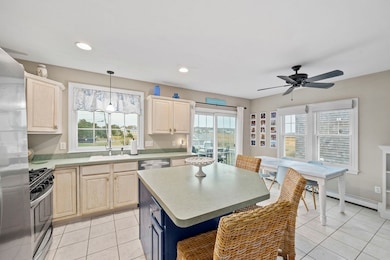
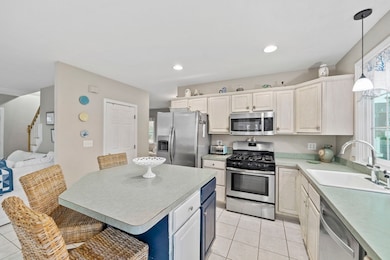
OFFERS DUE MONDAY, NOVEMBER 10TH AT 4:00 P.M. PLEASE MAKE GOOD THROUGH TUESDAY, NOVEMBER 11TH AT NOON. Desirable Rexhame Beach community! This pretty and welcoming home is nestled on a coveted street that runs between the ocean and the South River! Built in 1997, it has been owned and lovingly maintained by the same family ever since! Step inside to an inviting first floor open concept space that embraces the natural light and coastal charm. A comfortable living room featuring high ceilings, gas fireplace, and custom built-ins flows seamlessly into a light and airy kitchen and dining area. An adjoining family room offers additional space for gathering or quiet time, and a full bath with laundry offer convenience. Upstairs, a spacious front to back primary bedroom and two additional generously sized bedrooms, and full bath with double vanity. Spend your summer days on the sprawling, sandy Rexhame beach, enjoy the gorgeous views of the river, watch the spectacular sunrises and sunsets!
| Date | Type | Sale Price | Title Company |
|---|---|---|---|
| Quit Claim Deed | $800,000 | -- | |
| Land Court Massachusetts | $200,000 | -- | |
| Land Court Massachusetts | $200,000 | -- | |
| Land Court Massachusetts | $47,500 | -- | |
| Land Court Massachusetts | $47,500 | -- |
| Date | Status | Loan Amount | Loan Type |
|---|---|---|---|
| Open | $640,000 | New Conventional | |
| Previous Owner | $40,000 | No Value Available | |
| Previous Owner | $140,000 | No Value Available | |
| Previous Owner | $110,000 | Purchase Money Mortgage |
| Date | Event | Price | List to Sale | Price per Sq Ft |
|---|---|---|---|---|
| 12/19/2025 12/19/25 | Sold | $800,000 | 0.0% | $510 / Sq Ft |
| 11/10/2025 11/10/25 | Pending | -- | -- | -- |
| 11/06/2025 11/06/25 | For Sale | $799,900 | -- | $510 / Sq Ft |
| Year | Tax Paid | Tax Assessment Tax Assessment Total Assessment is a certain percentage of the fair market value that is determined by local assessors to be the total taxable value of land and additions on the property. | Land | Improvement |
|---|---|---|---|---|
| 2025 | $6,403 | $646,800 | $317,600 | $329,200 |
| 2024 | $6,211 | $597,800 | $297,800 | $300,000 |
| 2023 | $5,852 | $529,200 | $268,000 | $261,200 |
| 2022 | $5,852 | $451,900 | $228,300 | $223,600 |
| 2021 | $5,537 | $419,800 | $218,400 | $201,400 |
| 2020 | $5,124 | $384,400 | $188,600 | $195,800 |
| 2019 | $4,995 | $373,300 | $188,600 | $184,700 |
| 2018 | $4,950 | $370,200 | $188,600 | $181,600 |
| 2017 | $4,769 | $347,600 | $178,700 | $168,900 |
| 2016 | $4,528 | $326,200 | $168,700 | $157,500 |
| 2015 | $4,285 | $322,400 | $168,700 | $153,700 |
| 2014 | $4,224 | $317,800 | $168,700 | $149,100 |
Seller's Agent in 2025
Sherry Costello
Waterfront Realty Group
(781) 799-8880
13 in this area
71 Total Sales
K
Buyer's Agent in 2025
Kasey Mauro
Ginny Martins & Associates
(609) 385-5125
1 in this area
10 Total Sales
Source: MLS Property Information Network (MLS PIN)
MLS Number: 73452406
APN: MARS-000012K-000009-000012
Disclaimer: Certain information contained herein is derived from information provided by parties other than Homes.com. All information provided is deemed reliable, but is not guaranteed to be accurate and should be independently verified.
![]() The property listing data and information, or the Images, set forth herein were provided to MLS Property Information Network, Inc. from third party sources, including sellers, lessors and public records, and were compiled by MLS Property Information Network, Inc. The property listing data and information, and the Images, are for the personal, non-commercial use of consumers having a good faith interest in purchasing or leasing listed properties of the type displayed to them and may not be used for any purpose other than to identify prospective properties which such consumers may have a good faith interest in purchasing or leasing. MLS Property Information Network, Inc. and its subscribers disclaim any and all representations and warranties as to the accuracy of the property listing data and information, or as to the accuracy of any of the Images, set forth herein.
The property listing data and information, or the Images, set forth herein were provided to MLS Property Information Network, Inc. from third party sources, including sellers, lessors and public records, and were compiled by MLS Property Information Network, Inc. The property listing data and information, and the Images, are for the personal, non-commercial use of consumers having a good faith interest in purchasing or leasing listed properties of the type displayed to them and may not be used for any purpose other than to identify prospective properties which such consumers may have a good faith interest in purchasing or leasing. MLS Property Information Network, Inc. and its subscribers disclaim any and all representations and warranties as to the accuracy of the property listing data and information, or as to the accuracy of any of the Images, set forth herein.
Ask me questions while you tour the home.