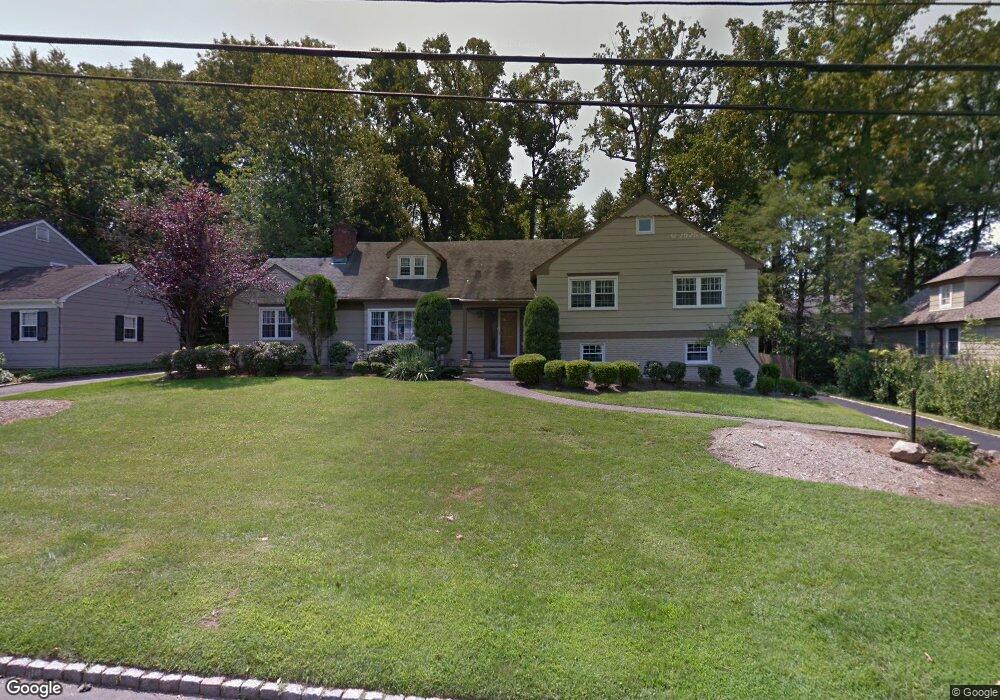
55 Addison Dr Short Hills, NJ 07078
Estimated Value: $2,240,000 - $2,401,000
--
Bed
--
Bath
2,952
Sq Ft
$782/Sq Ft
Est. Value
About This Home
This home is located at 55 Addison Dr, Short Hills, NJ 07078 and is currently estimated at $2,309,132, approximately $782 per square foot. 55 Addison Dr is a home located in Essex County with nearby schools including Hartshorn Elementary School, Millburn Middle School, and Millburn High School.
Ownership History
Date
Name
Owned For
Owner Type
Purchase Details
Closed on
Jul 24, 2006
Sold by
Mazzarino Aldo
Bought by
Musaji Yusufali and Musaji Naomi
Current Estimated Value
Home Financials for this Owner
Home Financials are based on the most recent Mortgage that was taken out on this home.
Original Mortgage
$896,000
Outstanding Balance
$536,326
Interest Rate
6.8%
Mortgage Type
New Conventional
Estimated Equity
$1,772,806
Create a Home Valuation Report for This Property
The Home Valuation Report is an in-depth analysis detailing your home's value as well as a comparison with similar homes in the area
Home Values in the Area
Average Home Value in this Area
Purchase History
| Date | Buyer | Sale Price | Title Company |
|---|---|---|---|
| Musaji Yusufali | $1,120,000 | -- |
Source: Public Records
Mortgage History
| Date | Status | Borrower | Loan Amount |
|---|---|---|---|
| Open | Musaji Yusufali | $896,000 |
Source: Public Records
Tax History Compared to Growth
Tax History
| Year | Tax Paid | Tax Assessment Tax Assessment Total Assessment is a certain percentage of the fair market value that is determined by local assessors to be the total taxable value of land and additions on the property. | Land | Improvement |
|---|---|---|---|---|
| 2025 | $30,664 | $1,567,700 | $735,300 | $832,400 |
| 2024 | $30,664 | $1,567,700 | $735,300 | $832,400 |
| 2022 | $30,460 | $1,567,700 | $735,300 | $832,400 |
| 2021 | $30,382 | $1,567,700 | $735,300 | $832,400 |
| 2020 | $30,194 | $1,567,700 | $735,300 | $832,400 |
| 2019 | $30,257 | $1,567,700 | $735,300 | $832,400 |
| 2018 | $29,818 | $1,567,700 | $735,300 | $832,400 |
| 2017 | $22,840 | $1,230,600 | $735,300 | $495,300 |
| 2016 | $20,566 | $954,800 | $436,000 | $518,800 |
| 2015 | $20,099 | $954,800 | $436,000 | $518,800 |
| 2014 | $19,249 | $954,800 | $436,000 | $518,800 |
Source: Public Records
Map
Nearby Homes
- 19 Shelley Rd
- 149 Hillcrest Ave
- 55 Oxbow Ln
- 368 Hartshorn Dr
- 29 Wordsworth Rd
- 59 West Rd
- 60 Fernwood Rd
- 30 Wildwood Ln
- 82 Browning Rd
- 6 Cambridge Dr
- 26 Dorset Ln
- 330 Hartshorn Dr
- 16 West Rd
- 14 Dorset Ln
- 80 Canoe Brook Rd
- 12 Coniston Rd
- 181 Summit Ave
- 50 Bellevue Ave
- 115 Beechwood Rd
- 290 Long Hill Dr