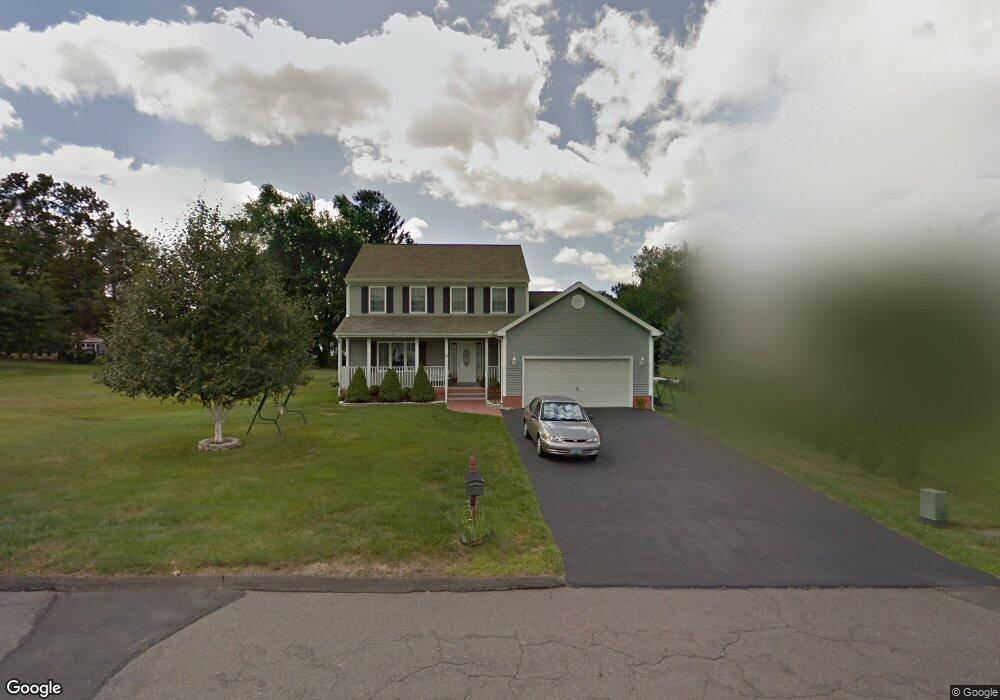
55 Alling Ct Berlin, CT 06037
Estimated Value: $494,977 - $621,000
3
Beds
3
Baths
1,850
Sq Ft
$291/Sq Ft
Est. Value
About This Home
This home is located at 55 Alling Ct, Berlin, CT 06037 and is currently estimated at $539,244, approximately $291 per square foot. 55 Alling Ct is a home located in Hartford County with nearby schools including Mary E. Griswold School, Catherine M. Mcgee Middle School, and Berlin High School.
Ownership History
Date
Name
Owned For
Owner Type
Purchase Details
Closed on
Apr 29, 2003
Sold by
Pagano Pasquale and Pagano Pasqualina
Bought by
C&C Bldrs Llc
Current Estimated Value
Purchase Details
Closed on
Jan 7, 2002
Sold by
C & C Bldrs Llc
Bought by
Szczygla Andrzej and Szczygla Julia
Home Financials for this Owner
Home Financials are based on the most recent Mortgage that was taken out on this home.
Original Mortgage
$70,000
Interest Rate
6.72%
Create a Home Valuation Report for This Property
The Home Valuation Report is an in-depth analysis detailing your home's value as well as a comparison with similar homes in the area
Home Values in the Area
Average Home Value in this Area
Purchase History
| Date | Buyer | Sale Price | Title Company |
|---|---|---|---|
| C&C Bldrs Llc | $30,000 | -- | |
| C & C Bldrs Llc | $30,000 | -- | |
| Szczygla Andrzej | $237,500 | -- | |
| Szczygla Andrzej | $237,500 | -- |
Source: Public Records
Mortgage History
| Date | Status | Borrower | Loan Amount |
|---|---|---|---|
| Previous Owner | Szczygla Andrzej | $70,000 |
Source: Public Records
Tax History
| Year | Tax Paid | Tax Assessment Tax Assessment Total Assessment is a certain percentage of the fair market value that is determined by local assessors to be the total taxable value of land and additions on the property. | Land | Improvement |
|---|---|---|---|---|
| 2025 | $8,518 | $277,900 | $87,900 | $190,000 |
| 2024 | $8,395 | $277,900 | $87,900 | $190,000 |
| 2023 | $8,215 | $277,900 | $87,900 | $190,000 |
| 2022 | $7,569 | $220,600 | $78,400 | $142,200 |
| 2021 | $7,485 | $220,600 | $78,400 | $142,200 |
| 2020 | $7,485 | $220,600 | $78,400 | $142,200 |
| 2019 | $7,485 | $220,600 | $78,400 | $142,200 |
| 2018 | $7,170 | $220,600 | $78,400 | $142,200 |
| 2017 | $7,115 | $225,100 | $77,700 | $147,400 |
| 2016 | $6,581 | $213,600 | $77,700 | $135,900 |
| 2015 | $6,483 | $213,600 | $77,700 | $135,900 |
| 2014 | $5,905 | $204,200 | $77,700 | $126,500 |
Source: Public Records
Map
Nearby Homes
Your Personal Tour Guide
Ask me questions while you tour the home.