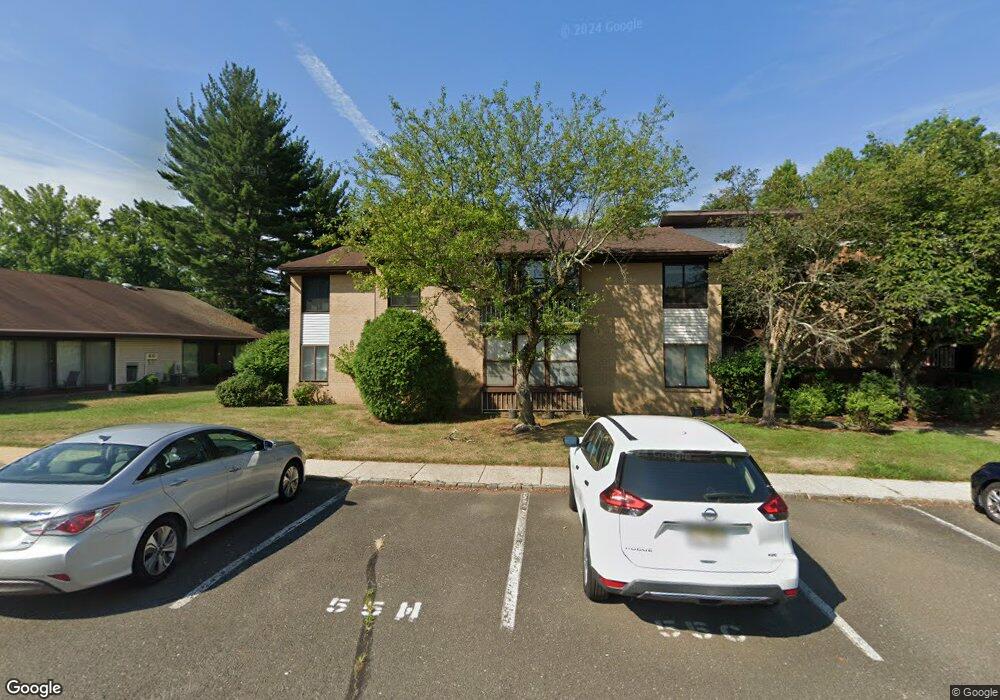
NOT LISTED FOR SALE

Estimated Value: $259,074 - $282,000

2 Beds
1 Bath
1,130 Sq Ft
$240/Sq Ft Est. Value

About This Home

This home is located at 55 Amberly Dr Unit J, Manalapan, NJ 07726 and is currently estimated at $271,019, approximately $239 per square foot. 55 Amberly Dr Unit J is a home located in Monmouth County with nearby schools including Milford Brook Elementary School, Pine Brook Elementary School, and Manalapan-Englishtown Middle School.

Ownership History

Date Name Owned For Owner Type

Purchase Details

Closed on
May 20, 2022
Sold by
Sherman and Randi
Bought by
Sumin Eduard
Current Estimated Value
$271,019

Purchase Details

Closed on
Sep 25, 2017
Sold by
Zysberg Abraham and Zysberg Rose
Bought by
Sherman Charles and Sherman Randi

Purchase Details

Closed on
Jul 18, 2000
Sold by
Goren Sally
Bought by
Zysberg Abraham and Zysberg Rose

Purchase Details

Closed on
Nov 12, 1996
Sold by
Portniy Joyce
Bought by
Goren Sally
Source: Public Records

Range of Values:

Collateral Analytics

Collateral Analytics Collateral Analytics AVMs (Automated Valuation Model) employ a number of statistical approaches combined with neighborhood-specific comparable selection guarantees the most up-to-date and precise valuations.

Not Available

Collateral Analytics does not have data for the current month. Please view the chart for historical values.

ICE

ICE Mortgage Technology ICE Mortgage Technology’s AVM (Automated Valuation Model) is a state-of-the-art online residential property valuation tool that provides a quick and accurate estimate of the value of almost any home in the U.S.

Not Available

ICE Mortgage Technology does not have data for the current month. Please view the chart for historical values.

First American

First American First American Data & Analytics’ next-generation AVM combines unrivaled data assets with a blended ensemble of valuation models to produce highly accurate, reliable valuations you can trust.

Not Available

First American does not have data for the current month. Please view the chart for historical values.

Quantarium

Quantarium Quantarium’s valuation service, repeatedly proven the industry’s most accurate and comprehensive, is supercharged with a self-learning and auto-tuning AI engine that continually becomes smarter and more accurate as it processes daily inputs from the industry’s leading RE data lake.

Not Available

Quantarium does not have data for the current month. Please view the chart for historical values.

Average Value
Not Available
List Price
Sold Price
Create a Home Valuation Report for This Property
The Home Valuation Report is an in-depth analysis detailing your home's value as well as a comparison with similar homes in the area

Home Values in the Area

Source: Public Records

Average Home Value in this Area


Source: Public Records

Purchase History

Date Buyer Sale Price Title Company
Sumin Eduard $230,000 Absolute Title
Sherman Charles $124,000 --
Zysberg Abraham $66,000 --
Goren Sally $70,000 --
Source: Public Records

Tax History Compared to Growth

Source: Public Records

Tax History

Year Tax Paid Tax Assessment Tax Assessment Total Assessment is a certain percentage of the fair market value that is determined by local assessors to be the total taxable value of land and additions on the property. Land Improvement
2024 $3,829 $246,800 $115,000 $131,800
2023 $3,829 $230,100 $86,000 $144,100
2022 $3,218 $184,600 $62,000 $122,600
2021 $3,218 $155,000 $46,000 $109,000
2020 $2,903 $141,400 $33,000 $108,400
2019 $2,795 $136,000 $33,000 $103,000
2018 $2,505 $121,200 $23,000 $98,200
2017 $2,562 $124,000 $30,000 $94,000
2016 $2,348 $115,000 $22,200 $92,800
2015 $2,444 $118,400 $28,000 $90,400
2014 $1,863 $87,900 $18,000 $69,900
Source: Public Records

Map