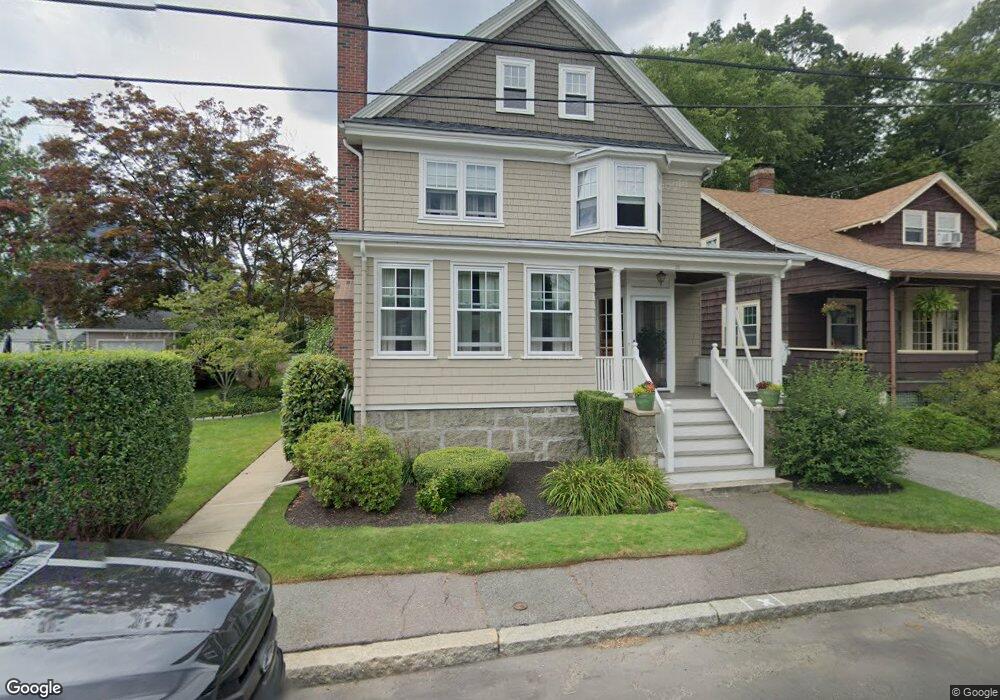
55 Appleton St Salem, MA 01970
North Salem NeighborhoodEstimated Value: $798,479 - $948,000
4
Beds
3
Baths
2,488
Sq Ft
$348/Sq Ft
Est. Value
About This Home
This home is located at 55 Appleton St, Salem, MA 01970 and is currently estimated at $866,620, approximately $348 per square foot. 55 Appleton St is a home located in Essex County with nearby schools including Bates Elementary School, Saltonstall School, and Carlton Elementary School.
Ownership History
Date
Name
Owned For
Owner Type
Purchase Details
Closed on
Oct 17, 2014
Sold by
Bolduc Michael J and Bolduc Elizabeth A
Bought by
Bolduc Ft
Current Estimated Value
Purchase Details
Closed on
Oct 8, 1987
Sold by
Barnett Eleanor G
Bought by
Bolduc Michael J
Create a Home Valuation Report for This Property
The Home Valuation Report is an in-depth analysis detailing your home's value as well as a comparison with similar homes in the area
Home Values in the Area
Average Home Value in this Area
Purchase History
| Date | Buyer | Sale Price | Title Company |
|---|---|---|---|
| Bolduc Ft | -- | -- | |
| Bolduc Michael J | $148,500 | -- |
Source: Public Records
Mortgage History
| Date | Status | Borrower | Loan Amount |
|---|---|---|---|
| Previous Owner | Bolduc Michael J | $160,000 | |
| Previous Owner | Bolduc Michael J | $125,000 | |
| Previous Owner | Bolduc Michael J | $113,500 |
Source: Public Records
Tax History
| Year | Tax Paid | Tax Assessment Tax Assessment Total Assessment is a certain percentage of the fair market value that is determined by local assessors to be the total taxable value of land and additions on the property. | Land | Improvement |
|---|---|---|---|---|
| 2025 | $7,725 | $681,200 | $219,400 | $461,800 |
| 2024 | $7,319 | $629,900 | $208,500 | $421,400 |
| 2023 | $7,078 | $565,800 | $192,400 | $373,400 |
| 2022 | $6,751 | $509,500 | $186,000 | $323,500 |
| 2021 | $6,657 | $482,400 | $173,200 | $309,200 |
| 2020 | $6,352 | $439,600 | $163,600 | $276,000 |
| 2019 | $6,325 | $418,900 | $155,200 | $263,700 |
| 2018 | $6,121 | $398,000 | $147,500 | $250,500 |
| 2017 | $5,724 | $360,900 | $124,400 | $236,500 |
| 2016 | $5,566 | $355,200 | $118,700 | $236,500 |
| 2015 | -- | $323,200 | $109,000 | $214,200 |
Source: Public Records
Map
Nearby Homes
- 27 Liberty Hill Ave
- 8 Cushing St Unit 2
- 16 Oakland St
- 44 Orne St Unit 44
- 9 Highland St
- 21 Manning St
- 40 Buffum St Unit 2
- 40 Buffum St Unit 1
- 41 Dearborn St
- 30 Driscoll St
- 17 Orchard St
- 112 North St
- 41 Northend St
- 16 Franklin St Unit 2403
- 16 Franklin St Unit 1303
- 16 Franklin St Unit 2202
- 3 S Mason St
- 86 Flint St
- 111 Mason St
- 16 River St
- 53 Appleton St
- 57 Appleton St
- 32 Fairmount St
- 27 Nursery St
- 59 Appleton St
- 28 Fairmount St
- 52 Appleton St Unit 54
- 29 Nursery St
- 54 Appleton St
- 34 Fairmount St
- 34 Fairmount St Unit 1
- 36 Fairmount St
- 36 Fairmount St Unit 3
- 36 Fairmount St Unit 1
- 23 Nursery St
- 23 Nursery St Unit 23 Nursery St
- 56 Appleton St
- 31 Nursery St
- 31 Nursery St Unit 3
- 61 Appleton St
Your Personal Tour Guide
Ask me questions while you tour the home.