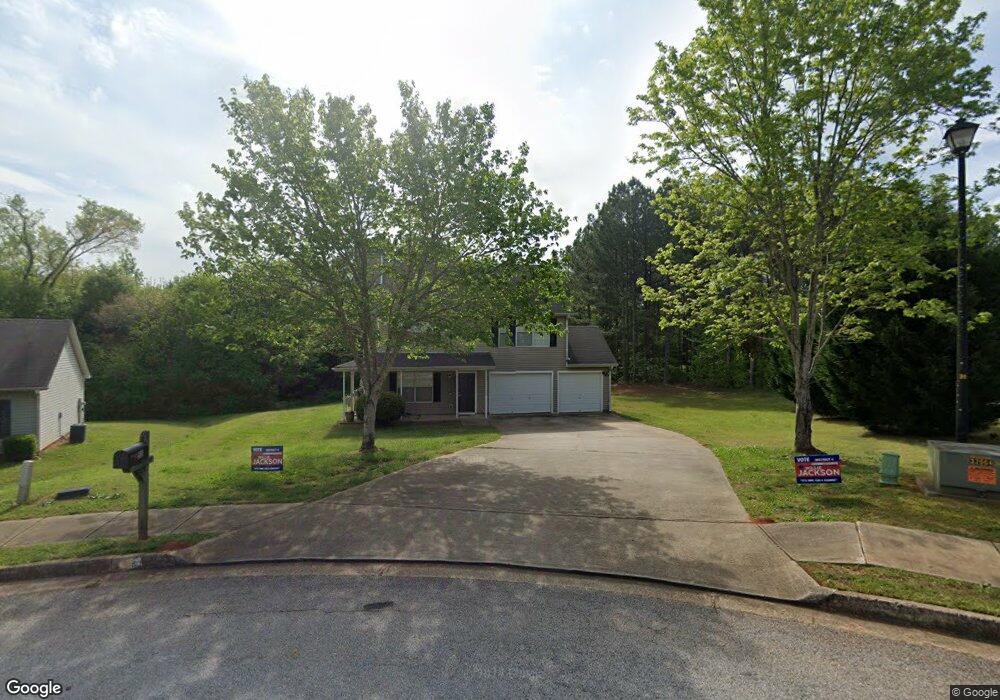
55 Arnold Way Unit 57 Covington, GA 30016
Estimated Value: $244,545 - $259,000
3
Beds
3
Baths
1,524
Sq Ft
$165/Sq Ft
Est. Value
About This Home
This home is located at 55 Arnold Way Unit 57, Covington, GA 30016 and is currently estimated at $251,386, approximately $164 per square foot. 55 Arnold Way Unit 57 is a home located in Newton County with nearby schools including South Salem Elementary School, Liberty Middle School, and Alcovy High School.
Ownership History
Date
Name
Owned For
Owner Type
Purchase Details
Closed on
Nov 4, 2015
Sold by
Dubose Peter A
Bought by
Cochrane Debbie C
Current Estimated Value
Purchase Details
Closed on
Jan 31, 2008
Sold by
Novastar Mtg Inc
Bought by
Dubose Peter A
Home Financials for this Owner
Home Financials are based on the most recent Mortgage that was taken out on this home.
Original Mortgage
$90,000
Interest Rate
5.97%
Mortgage Type
New Conventional
Purchase Details
Closed on
Jul 3, 2007
Sold by
Everett John B and Everett Candece M
Bought by
Novastar Mtg Inc
Purchase Details
Closed on
Dec 10, 2004
Sold by
Robertson Const Co
Bought by
Everett John B and Everett Candece
Home Financials for this Owner
Home Financials are based on the most recent Mortgage that was taken out on this home.
Original Mortgage
$119,900
Interest Rate
11.4%
Mortgage Type
New Conventional
Create a Home Valuation Report for This Property
The Home Valuation Report is an in-depth analysis detailing your home's value as well as a comparison with similar homes in the area
Home Values in the Area
Average Home Value in this Area
Purchase History
| Date | Buyer | Sale Price | Title Company |
|---|---|---|---|
| Cochrane Debbie C | $87,100 | -- | |
| Dubose Peter A | $90,000 | -- | |
| Novastar Mtg Inc | $108,221 | -- | |
| Everett John B | $119,900 | -- |
Source: Public Records
Mortgage History
| Date | Status | Borrower | Loan Amount |
|---|---|---|---|
| Previous Owner | Dubose Peter A | $90,000 | |
| Previous Owner | Everett John B | $119,900 |
Source: Public Records
Tax History Compared to Growth
Tax History
| Year | Tax Paid | Tax Assessment Tax Assessment Total Assessment is a certain percentage of the fair market value that is determined by local assessors to be the total taxable value of land and additions on the property. | Land | Improvement |
|---|---|---|---|---|
| 2024 | $2,847 | $109,800 | $15,200 | $94,600 |
| 2023 | $2,615 | $93,960 | $5,600 | $88,360 |
| 2022 | $2,002 | $71,360 | $5,600 | $65,760 |
| 2021 | $2,032 | $64,840 | $5,600 | $59,240 |
| 2020 | $1,784 | $51,200 | $5,600 | $45,600 |
| 2019 | $1,642 | $46,280 | $5,600 | $40,680 |
| 2018 | $1,168 | $32,160 | $5,000 | $27,160 |
| 2017 | $1,209 | $33,360 | $5,000 | $28,360 |
| 2016 | $1,116 | $30,640 | $5,000 | $25,640 |
| 2015 | $975 | $26,560 | $3,000 | $23,560 |
| 2014 | $876 | $23,760 | $0 | $0 |
Source: Public Records
Map
Nearby Homes
- 331 Highway 162
- 711 Highway 162
- 215 Morningside Dr
- 195 Twin Lakes Dr
- 110 Twin Lakes Dr
- 0 Lower River Rd Unit 10461341
- 55 Twin Lakes Dr
- 910 Georgia 162
- 102 Tempie Ln
- 0 Roseberry Rd
- 0 Eleanor Dr Unit 10443925
- 0 Tempie Ln
- 230 Lynn Dr
- 940 Mote Rd
- 30 Magan Ct
- 5798 Salem Rd
- 65 Heaton Place Trail
- 140 Sunflower Ln
- 15 Lisa Ct
- 55 Arnold Way
- 60 Arnold Way
- 45 Arnold Way
- 70 Copeland Cir
- 35 Arnold Way
- 65 Copeland Cir
- 50 Arnold Way
- 40 Green Commons Dr
- 50 Green Commons Dr
- 60 Green Commons Dr
- 70 Green Commons Dr
- 25 Arnold Way
- 0 Arnold Way Unit 8674188
- 0 Arnold Way Unit 8336665
- 0 Arnold Way
- 40 Arnold Way
- 60 Copeland Cir
- 80 Green Commons Dr
- 30 Arnold Way
- 30 Green Commons Dr