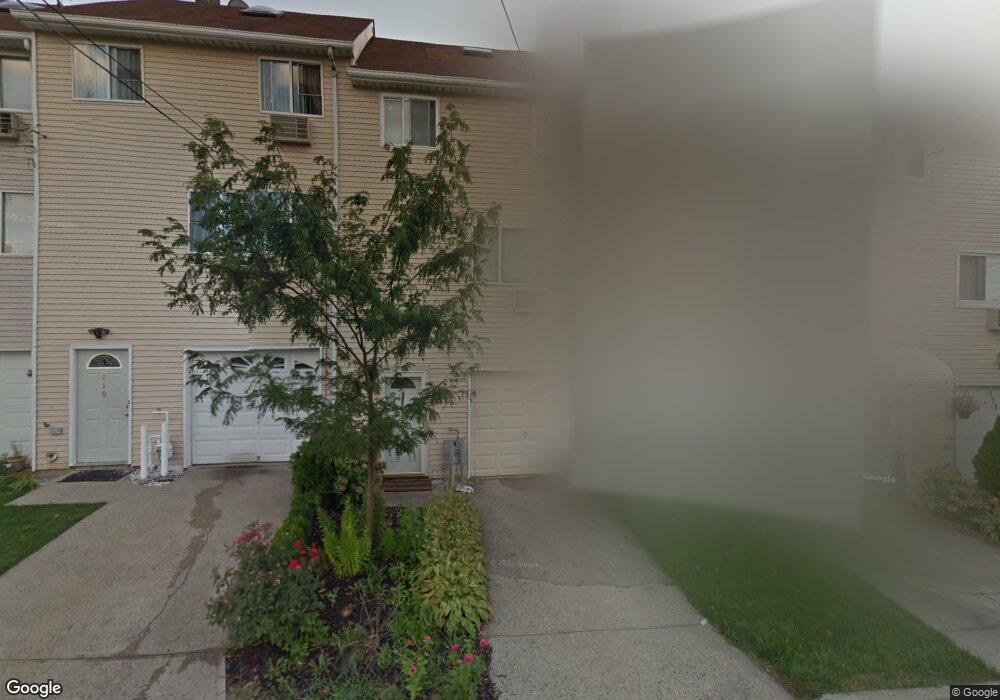
Imperial Towers 55 Austin Place Unit 7X Staten Island, NY 10304
Tompkinsville NeighborhoodEstimated Value: $363,000 - $456,000
--
Bed
--
Bath
1,001
Sq Ft
$408/Sq Ft
Est. Value
About This Home
This home is located at 55 Austin Place Unit 7X, Staten Island, NY 10304 and is currently estimated at $408,676, approximately $408 per square foot. 55 Austin Place Unit 7X is a home located in Richmond County with nearby schools including P.S. 16 John J Driscoll, P.S. 74 Future Leaders Elementary School, and Fort Hill Collaborative Elementary.
Ownership History
Date
Name
Owned For
Owner Type
Purchase Details
Closed on
Oct 7, 2011
Sold by
Mulligan Margaret
Bought by
Pujol Lolita
Current Estimated Value
Home Financials for this Owner
Home Financials are based on the most recent Mortgage that was taken out on this home.
Original Mortgage
$192,000
Outstanding Balance
$131,015
Interest Rate
4.11%
Mortgage Type
New Conventional
Estimated Equity
$277,661
Purchase Details
Closed on
Aug 1, 2007
Sold by
Fallon Derrick T and Fallon Shawn T
Bought by
Mulligan Margaret
Home Financials for this Owner
Home Financials are based on the most recent Mortgage that was taken out on this home.
Original Mortgage
$150,000
Interest Rate
6.74%
Mortgage Type
Purchase Money Mortgage
Purchase Details
Closed on
Sep 20, 2006
Sold by
Fallon Derrick T
Bought by
Fallon Derrick T and Fallon Shawn T
Purchase Details
Closed on
Jun 3, 2002
Sold by
Deyak Katherine and Lepp Katherine
Bought by
Fallon Derrick T
Home Financials for this Owner
Home Financials are based on the most recent Mortgage that was taken out on this home.
Original Mortgage
$102,000
Interest Rate
6.18%
Mortgage Type
Purchase Money Mortgage
Create a Home Valuation Report for This Property
The Home Valuation Report is an in-depth analysis detailing your home's value as well as a comparison with similar homes in the area
Home Values in the Area
Average Home Value in this Area
Purchase History
| Date | Buyer | Sale Price | Title Company |
|---|---|---|---|
| Pujol Lolita | $240,000 | Fidelity National Title Insu | |
| Mulligan Margaret | $310,000 | None Available | |
| Fallon Derrick T | -- | None Available | |
| Fallon Derrick T | $136,000 | Titleserv |
Source: Public Records
Mortgage History
| Date | Status | Borrower | Loan Amount |
|---|---|---|---|
| Open | Pujol Lolita | $192,000 | |
| Previous Owner | Mulligan Margaret | $150,000 | |
| Previous Owner | Fallon Derrick T | $102,000 |
Source: Public Records
Tax History Compared to Growth
Tax History
| Year | Tax Paid | Tax Assessment Tax Assessment Total Assessment is a certain percentage of the fair market value that is determined by local assessors to be the total taxable value of land and additions on the property. | Land | Improvement |
|---|---|---|---|---|
| 2025 | $3,976 | $38,458 | $1,951 | $36,507 |
| 2024 | $2,933 | $34,219 | $1,951 | $32,268 |
| 2023 | $2,819 | $34,286 | $1,951 | $32,335 |
| 2022 | $2,740 | $33,524 | $1,951 | $31,573 |
| 2021 | $3,456 | $30,631 | $1,951 | $28,680 |
| 2020 | $2,615 | $35,778 | $1,951 | $33,827 |
| 2019 | $2,614 | $35,035 | $1,951 | $33,084 |
| 2018 | $3,210 | $35,433 | $1,951 | $33,482 |
| 2017 | $3,009 | $25,825 | $1,951 | $23,874 |
| 2016 | $2,919 | $25,420 | $1,951 | $23,469 |
| 2015 | $2,004 | $24,992 | $1,951 | $23,041 |
| 2014 | $2,004 | $26,182 | $1,950 | $24,232 |
Source: Public Records
About Imperial Towers
Map
Nearby Homes
- 55 Austin Place Unit 7W
- 55 Austin Place Unit 7D
- 55 Austin Place Unit 2Y
- 55 Austin Place Unit 5S
- 55 Austin Place Unit 6P
- 55 Austin Place Unit 7M
- 55 Austin Place Unit 5F
- 55 Austin Place Unit 2J
- 264 Ward Ave
- 22 Pommer Ave
- 87 Louis St
- 360 Victory Blvd
- 40 Creston Place
- 59 Oxford Place
- 115 Oxford Place
- 86 Ward Ave
- 59 Bayview Place
- 3 Silver Lake Rd
- 135 Nixon Ave
- 11 Bayview Place
- 55 Austin Place Unit 5R
- 55 Austin Place Unit 1N
- 55 Austin Place Unit 7V
- 55 Austin Place Unit 7Z
- 55 Austin Place Unit 7X
- 55 Austin Place Unit 7V
- 55 Austin Place Unit 7T
- 55 Austin Place Unit 7S
- 55 Austin Place Unit 7R
- 55 Austin Place Unit 7P
- 55 Austin Place Unit 7N
- 55 Austin Place Unit 7L
- 55 Austin Place Unit 7K
- 55 Austin Place Unit 7J
- 55 Austin Place Unit 7H
- 55 Austin Place Unit 7G
- 55 Austin Place Unit 7F
- 55 Austin Place Unit 7E
- 55 Austin Place Unit 7C
- 55 Austin Place Unit 7B