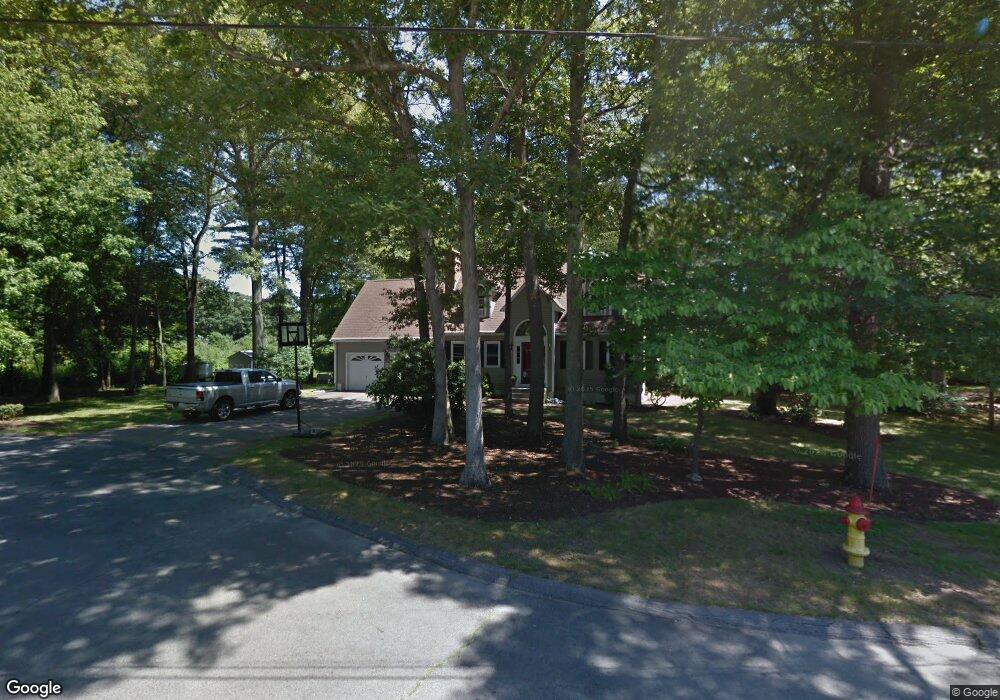
55 Berndt Dr Attleboro, MA 02703
Estimated Value: $566,000 - $700,470
4
Beds
2
Baths
2,285
Sq Ft
$289/Sq Ft
Est. Value
About This Home
This home is located at 55 Berndt Dr, Attleboro, MA 02703 and is currently estimated at $660,368, approximately $289 per square foot. 55 Berndt Dr is a home located in Bristol County with nearby schools including A. Irvin Studley Elementary School, Cyril K. Brennan Middle School, and Attleboro High School.
Ownership History
Date
Name
Owned For
Owner Type
Purchase Details
Closed on
Sep 12, 2017
Sold by
Young Brandon and Young Heidi
Bought by
Young Heidi
Current Estimated Value
Purchase Details
Closed on
May 18, 2004
Sold by
Decola Peter N and Decola Elise G
Bought by
Young Heidi and Young Brandon
Home Financials for this Owner
Home Financials are based on the most recent Mortgage that was taken out on this home.
Original Mortgage
$269,000
Interest Rate
5.47%
Mortgage Type
Purchase Money Mortgage
Purchase Details
Closed on
Feb 29, 2000
Sold by
Buxton Dean B and Buxton Denise A
Bought by
Decola Peter N and Decola Elise G
Home Financials for this Owner
Home Financials are based on the most recent Mortgage that was taken out on this home.
Original Mortgage
$199,900
Interest Rate
8.15%
Mortgage Type
Purchase Money Mortgage
Purchase Details
Closed on
Jun 28, 1989
Sold by
East Coast Dev Ltd
Bought by
Buxton Dean B
Create a Home Valuation Report for This Property
The Home Valuation Report is an in-depth analysis detailing your home's value as well as a comparison with similar homes in the area
Home Values in the Area
Average Home Value in this Area
Purchase History
| Date | Buyer | Sale Price | Title Company |
|---|---|---|---|
| Young Heidi | -- | -- | |
| Young Heidi | -- | -- | |
| Young Heidi | $369,900 | -- | |
| Young Heidi | $369,900 | -- | |
| Decola Peter N | $239,900 | -- | |
| Decola Peter N | $239,900 | -- | |
| Buxton Dean B | $190,800 | -- |
Source: Public Records
Mortgage History
| Date | Status | Borrower | Loan Amount |
|---|---|---|---|
| Previous Owner | Buxton Dean B | $22,000 | |
| Previous Owner | Young Heidi | $269,000 | |
| Previous Owner | Buxton Dean B | $199,900 |
Source: Public Records
Tax History Compared to Growth
Tax History
| Year | Tax Paid | Tax Assessment Tax Assessment Total Assessment is a certain percentage of the fair market value that is determined by local assessors to be the total taxable value of land and additions on the property. | Land | Improvement |
|---|---|---|---|---|
| 2025 | $7,708 | $614,200 | $169,100 | $445,100 |
| 2024 | $7,196 | $565,300 | $152,100 | $413,200 |
| 2023 | $6,892 | $503,400 | $153,700 | $349,700 |
| 2022 | $6,462 | $447,200 | $146,400 | $300,800 |
| 2021 | $6,068 | $410,000 | $141,000 | $269,000 |
| 2020 | $5,756 | $395,300 | $134,800 | $260,500 |
| 2019 | $5,408 | $381,900 | $132,200 | $249,700 |
| 2018 | $5,098 | $344,000 | $128,200 | $215,800 |
| 2017 | $4,874 | $335,000 | $124,900 | $210,100 |
| 2016 | $4,634 | $312,700 | $116,800 | $195,900 |
| 2015 | $4,351 | $295,800 | $116,800 | $179,000 |
| 2014 | $4,253 | $286,400 | $111,700 | $174,700 |
Source: Public Records
Map
Nearby Homes
- 52 Hawthorne St
- 101 South Ave Unit 803
- 660 Thacher St Unit 1402
- 31 Verndale Ave
- 49 Bushee St
- 34 Hawthorne St
- 46 Berwick Rd
- 0 Woodside Ave
- 17 Jewel Ave
- 22 Oakland Ave Unit 1
- 21 Dennis St
- 49 Dennis St
- 24 Oakland Ave Unit 1
- 62 Elizabeth St
- 30 Water St Unit 4
- 309 Thacher St
- 125 County St
- 74 West St Unit 5
- 74 West St Unit 18
- 29 Hodges St