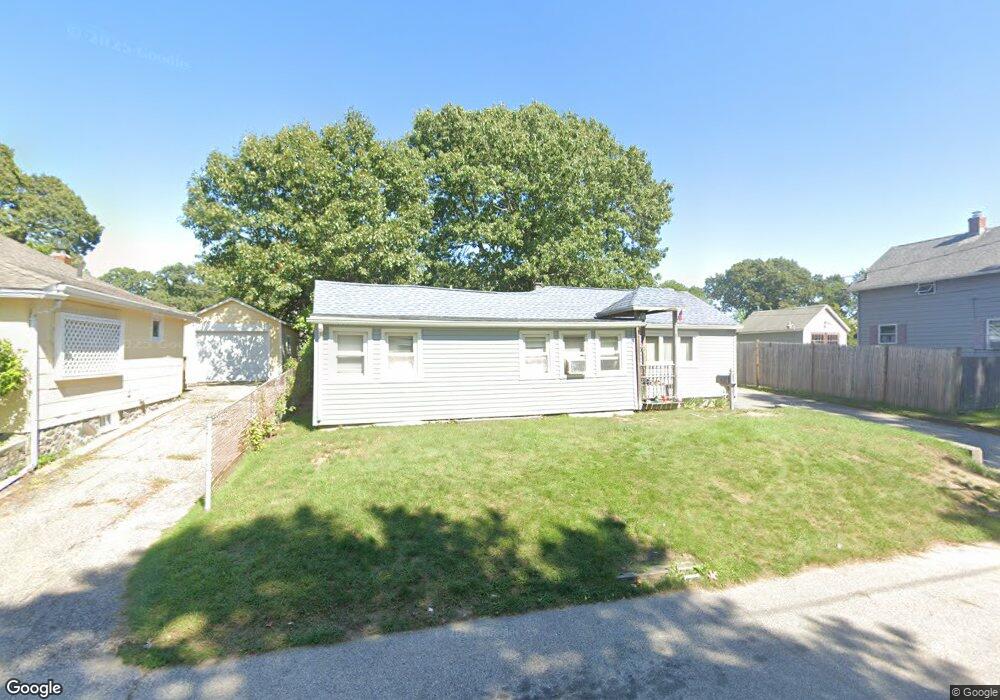
55 Booth Ave Riverside, RI 02915
Riverside NeighborhoodEstimated Value: $345,180 - $378,000
2
Beds
1
Bath
1,157
Sq Ft
$307/Sq Ft
Est. Value
About This Home
This home is located at 55 Booth Ave, Riverside, RI 02915 and is currently estimated at $355,295, approximately $307 per square foot. 55 Booth Ave is a home located in Providence County with nearby schools including East Providence High School, St Luke Elementary School, and Barrington Christian Academy.
Ownership History
Date
Name
Owned For
Owner Type
Purchase Details
Closed on
Apr 1, 2025
Sold by
East Providence City Of
Bought by
Reservoir Adventures Llc
Current Estimated Value
Purchase Details
Closed on
Mar 17, 2017
Sold by
Akers Donald E
Bought by
Akers Kimberley A
Purchase Details
Closed on
May 18, 1986
Bought by
Akers Donald E and Akers Annette M
Create a Home Valuation Report for This Property
The Home Valuation Report is an in-depth analysis detailing your home's value as well as a comparison with similar homes in the area
Home Values in the Area
Average Home Value in this Area
Purchase History
| Date | Buyer | Sale Price | Title Company |
|---|---|---|---|
| Reservoir Adventures Llc | $10,230 | None Available | |
| Reservoir Adventures Llc | $10,230 | None Available | |
| Akers Kimberley A | -- | -- | |
| Akers Kimberley A | -- | -- | |
| Akers Donald E | -- | -- | |
| Akers Kimberley A | -- | -- |
Source: Public Records
Mortgage History
| Date | Status | Borrower | Loan Amount |
|---|---|---|---|
| Previous Owner | Akers Donald E | $39,370 | |
| Previous Owner | Akers Donald E | $81,112 | |
| Previous Owner | Akers Donald E | $54,000 |
Source: Public Records
Tax History
| Year | Tax Paid | Tax Assessment Tax Assessment Total Assessment is a certain percentage of the fair market value that is determined by local assessors to be the total taxable value of land and additions on the property. | Land | Improvement |
|---|---|---|---|---|
| 2025 | $3,792 | $290,100 | $77,500 | $212,600 |
| 2024 | $4,176 | $272,400 | $64,600 | $207,800 |
| 2023 | $4,021 | $272,400 | $64,600 | $207,800 |
| 2022 | $4,129 | $188,900 | $47,700 | $141,200 |
| 2021 | $4,061 | $188,900 | $46,100 | $142,800 |
| 2020 | $3,889 | $188,900 | $46,100 | $142,800 |
| 2019 | $3,782 | $188,900 | $46,100 | $142,800 |
| 2018 | $3,684 | $161,000 | $49,200 | $111,800 |
| 2017 | $3,602 | $161,000 | $49,200 | $111,800 |
| 2016 | $3,584 | $161,000 | $49,200 | $111,800 |
| 2015 | $3,397 | $148,000 | $45,500 | $102,500 |
| 2014 | $3,397 | $148,000 | $45,500 | $102,500 |
Source: Public Records
Map
Nearby Homes
- 15 Claire St
- 10 Booth Ave
- 85 Hilton Ave
- 14 Winthrop St
- 0 Carousel Dr
- 41 White Ave
- 14 Benedict St
- 15 Plaza Dr
- 72 Stowe Ave
- 25 Winslow St
- 916 Bullocks Pt Ave
- 23 Albert Ave
- 9 Mystic Ave
- 45 Washington Rd
- 33 Pine St Unit 35
- 103 Burnside Ave
- 129 Shore Rd
- 25 Arnold St
- 28 Jefferson Ave
- 151 Willett Ave Unit 2
Your Personal Tour Guide
Ask me questions while you tour the home.