55 Bradfield Dr Lagrange, GA 30240
Estimated Value: $103,000 - $161,623
3
Beds
1
Bath
1,584
Sq Ft
$85/Sq Ft
Est. Value
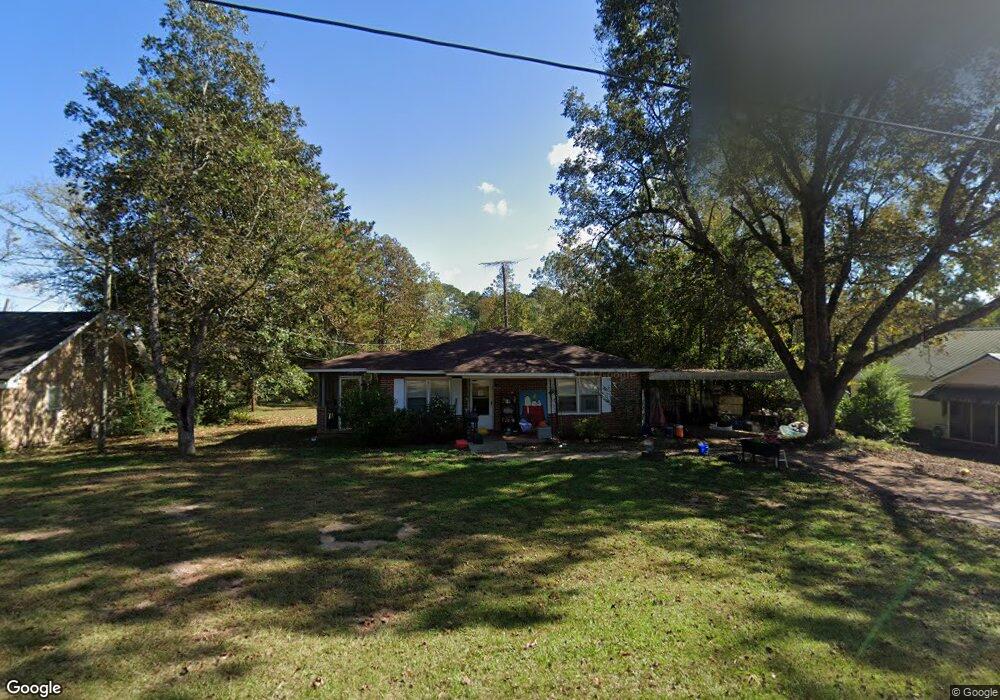
About This Home
This home is located at 55 Bradfield Dr, Lagrange, GA 30240 and is currently estimated at $134,656, approximately $85 per square foot. 55 Bradfield Dr is a home located in Troup County with nearby schools including Berta Weathersbee Elementary School, Long Cane Elementary School, and Whitesville Road Elementary School.
Ownership History
Date
Name
Owned For
Owner Type
Purchase Details
Closed on
Jan 5, 2024
Sold by
Ward Real Estate Investments Llc
Bought by
Chief Brothers Properties Llc
Current Estimated Value
Home Financials for this Owner
Home Financials are based on the most recent Mortgage that was taken out on this home.
Original Mortgage
$109,250
Outstanding Balance
$100,317
Interest Rate
6.29%
Mortgage Type
New Conventional
Estimated Equity
$34,339
Purchase Details
Closed on
Jan 11, 2012
Bought by
Ward Render
Purchase Details
Closed on
Jun 7, 2011
Sold by
Suntrust Mtg Inc
Bought by
Secretary Of Housing
Purchase Details
Closed on
Oct 30, 2007
Sold by
Warren James Elliotte
Bought by
Hill Steven Chad and Hill Jessica M
Home Financials for this Owner
Home Financials are based on the most recent Mortgage that was taken out on this home.
Original Mortgage
$86,640
Interest Rate
6.26%
Mortgage Type
FHA
Purchase Details
Closed on
Jan 1, 1950
Bought by
Warren J E
Create a Home Valuation Report for This Property
The Home Valuation Report is an in-depth analysis detailing your home's value as well as a comparison with similar homes in the area
Purchase History
| Date | Buyer | Sale Price | Title Company |
|---|---|---|---|
| Chief Brothers Properties Llc | $115,000 | -- | |
| Ward Render | $22,750 | -- | |
| Secretary Of Housing | $94,421 | -- | |
| Suntrust Mtg Inc | $94,421 | -- | |
| Hill Steven Chad | $88,000 | -- | |
| Warren J E | -- | -- |
Source: Public Records
Mortgage History
| Date | Status | Borrower | Loan Amount |
|---|---|---|---|
| Open | Chief Brothers Properties Llc | $109,250 | |
| Previous Owner | Hill Steven Chad | $86,640 |
Source: Public Records
Tax History
| Year | Tax Paid | Tax Assessment Tax Assessment Total Assessment is a certain percentage of the fair market value that is determined by local assessors to be the total taxable value of land and additions on the property. | Land | Improvement |
|---|---|---|---|---|
| 2025 | $1,425 | $52,260 | $5,480 | $46,780 |
| 2024 | $1,190 | $43,620 | $5,480 | $38,140 |
| 2023 | $958 | $35,120 | $5,480 | $29,640 |
| 2022 | $934 | $33,480 | $5,480 | $28,000 |
| 2021 | $630 | $20,892 | $5,040 | $15,852 |
| 2020 | $630 | $20,892 | $5,040 | $15,852 |
| 2019 | $611 | $20,252 | $4,000 | $16,252 |
| 2018 | $567 | $18,800 | $4,000 | $14,800 |
| 2017 | $567 | $18,800 | $4,000 | $14,800 |
| 2016 | $562 | $18,648 | $4,000 | $14,648 |
| 2015 | $563 | $18,648 | $4,000 | $14,648 |
| 2014 | $460 | $17,877 | $4,000 | $13,877 |
| 2013 | -- | $23,302 | $4,000 | $19,302 |
Source: Public Records
Map
Nearby Homes
- 0 Bradfield Dr Unit 10568803
- 8 Horace Carter Rd
- 808 S Fling Rd
- 427 Fling Rd
- 509 Connie Dr
- 22 Freeman Rd
- 275 Hanson Dr
- 0 Hanson Dr Unit 10641272
- 0 Glass Bridge Rd Unit 10679358
- 3 Reed Dr
- 105 Redwood Dr
- 103 Hawthorne Cir
- 0 Unit 10514554
- 124 Foxdale Dr
- 266 Glass Bridge Rd
- 134 Laurel Ridge Ave E
- 336 Whitaker Rd
- 120 Laurel Ridge Ave E
- 149 Laurel Ridge Ave E
- 104 Bridlewood Dr
- 65 Bradfield Dr
- 47 Bradfield Dr
- 54 Bradfield Dr
- 46 Bradfield Dr
- 73 Bradfield Dr
- 76 Bradfield Dr
- 85 Bradfield Dr
- 19 Bradfield Dr
- 84 Bradfield Dr
- 20 Bradfield Dr
- 2639 West Point Rd
- 94 Bradfield Dr
- 250 Bradfield Dr
- 2663 W Point Rd
- 2663 West Point Rd
- 101 Bradfield Dr
- 104 Bradfield Dr
- 0 Bradfield Dr Unit 8348693
- 0 Bradfield Dr Unit 8931502
- 0 Bradfield Dr Unit 7.52 Ac 8506083
Your Personal Tour Guide
Ask me questions while you tour the home.