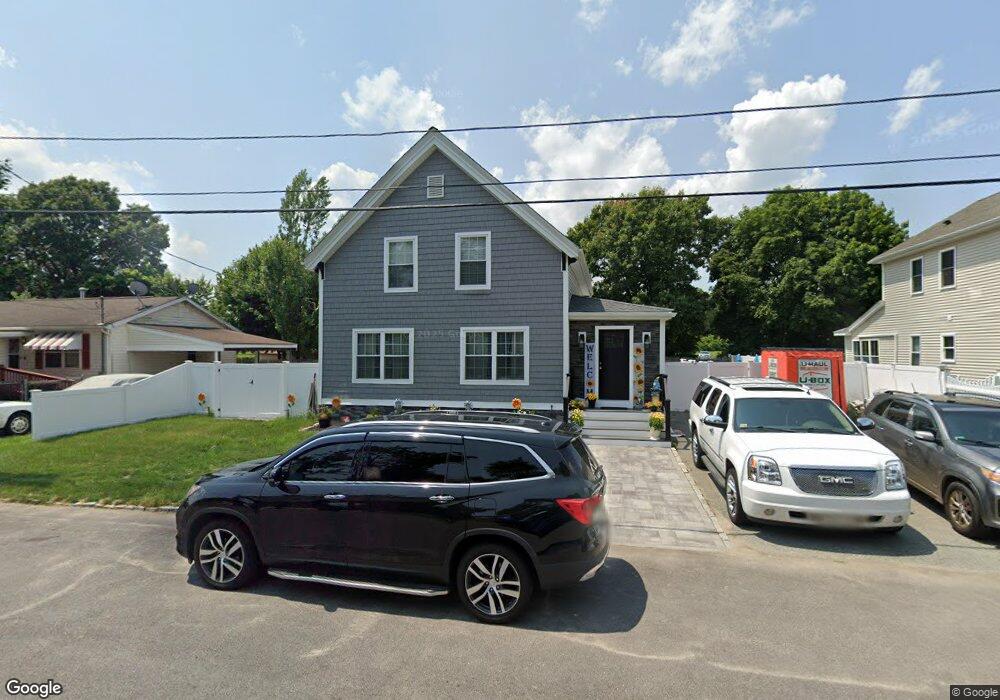
55 Broad St Warwick, RI 02888
Norwood NeighborhoodEstimated Value: $412,000 - $430,839
4
Beds
3
Baths
1,560
Sq Ft
$271/Sq Ft
Est. Value
About This Home
This home is located at 55 Broad St, Warwick, RI 02888 and is currently estimated at $422,210, approximately $270 per square foot. 55 Broad St is a home located in Kent County with nearby schools including St. Peter School.
Ownership History
Date
Name
Owned For
Owner Type
Purchase Details
Closed on
Dec 14, 2006
Sold by
Marie France Productio
Bought by
Tabor Corey and Plante Tami
Current Estimated Value
Home Financials for this Owner
Home Financials are based on the most recent Mortgage that was taken out on this home.
Original Mortgage
$168,800
Interest Rate
6.31%
Mortgage Type
Purchase Money Mortgage
Purchase Details
Closed on
Aug 30, 2006
Sold by
Pedro Kenneth R and Pedro Joan C
Bought by
Marie France Productio
Purchase Details
Closed on
Dec 21, 1992
Sold by
Costello James M
Bought by
Pedro Kenneth R and Pedro Joan
Create a Home Valuation Report for This Property
The Home Valuation Report is an in-depth analysis detailing your home's value as well as a comparison with similar homes in the area
Home Values in the Area
Average Home Value in this Area
Purchase History
| Date | Buyer | Sale Price | Title Company |
|---|---|---|---|
| Tabor Corey | $211,000 | -- | |
| Marie France Productio | $83,000 | -- | |
| Pedro Kenneth R | $90,000 | -- | |
| Pedro Kenneth R | $90,000 | -- |
Source: Public Records
Mortgage History
| Date | Status | Borrower | Loan Amount |
|---|---|---|---|
| Open | Pedro Kenneth R | $223,563 | |
| Closed | Pedro Kenneth R | $220,260 | |
| Closed | Pedro Kenneth R | $168,800 |
Source: Public Records
Tax History
| Year | Tax Paid | Tax Assessment Tax Assessment Total Assessment is a certain percentage of the fair market value that is determined by local assessors to be the total taxable value of land and additions on the property. | Land | Improvement |
|---|---|---|---|---|
| 2025 | $5,013 | $394,700 | $97,100 | $297,600 |
| 2024 | $4,402 | $304,200 | $84,400 | $219,800 |
| 2023 | $4,317 | $304,200 | $84,400 | $219,800 |
| 2022 | $3,619 | $193,200 | $55,100 | $138,100 |
| 2021 | $3,619 | $193,200 | $55,100 | $138,100 |
| 2020 | $3,619 | $193,200 | $55,100 | $138,100 |
| 2019 | $3,619 | $193,200 | $55,100 | $138,100 |
| 2018 | $3,099 | $149,000 | $55,100 | $93,900 |
| 2017 | $3,016 | $149,000 | $55,100 | $93,900 |
| 2016 | $3,016 | $149,000 | $55,100 | $93,900 |
| 2015 | $3,019 | $145,500 | $54,300 | $91,200 |
| 2014 | $2,919 | $145,500 | $54,300 | $91,200 |
| 2013 | $2,879 | $145,500 | $54,300 | $91,200 |
Source: Public Records
Map
Nearby Homes
- 27 Frederick St
- 35 Welfare Ave
- 396 Elm St
- 123 Harrington Ave
- 0 Elmwood Ave
- 341 Sumner Ave
- 1052 Post Rd
- 150 Riverside Ave
- 7 Michigan Ave
- 859 Pontiac Ave
- 47 Holburn Ave
- 33 Hemlock Ave
- 821 Post Rd
- 136 Sherwood Ave
- 120 Sherwood Ave
- 127 Sherwood Ave
- 111 Sherwood Ave
- 171 Sherwood Ave
- 10 Woburn St
- 77 Kentucky Ave