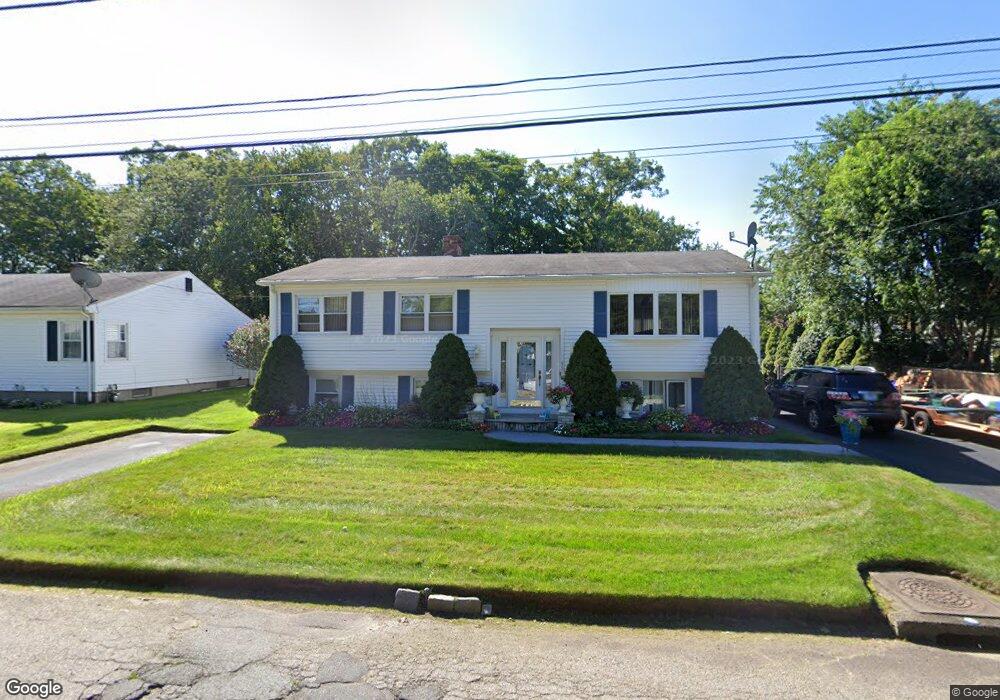
55 Brook Ave Riverside, RI 02915
Riverside NeighborhoodEstimated Value: $523,251 - $633,000
3
Beds
2
Baths
1,880
Sq Ft
$305/Sq Ft
Est. Value
About This Home
This home is located at 55 Brook Ave, Riverside, RI 02915 and is currently estimated at $572,563, approximately $304 per square foot. 55 Brook Ave is a home located in Providence County with nearby schools including East Providence High School, St Luke Elementary School, and St Mary Academy-Bay View.
Ownership History
Date
Name
Owned For
Owner Type
Purchase Details
Closed on
Sep 1, 1989
Sold by
Morelli Vincent P
Bought by
Silva Maria Da E
Current Estimated Value
Home Financials for this Owner
Home Financials are based on the most recent Mortgage that was taken out on this home.
Original Mortgage
$55,000
Interest Rate
9.7%
Mortgage Type
Purchase Money Mortgage
Create a Home Valuation Report for This Property
The Home Valuation Report is an in-depth analysis detailing your home's value as well as a comparison with similar homes in the area
Home Values in the Area
Average Home Value in this Area
Purchase History
| Date | Buyer | Sale Price | Title Company |
|---|---|---|---|
| Silva Maria Da E | $157,500 | -- | |
| Silva Maria Da E | $157,500 | -- |
Source: Public Records
Mortgage History
| Date | Status | Borrower | Loan Amount |
|---|---|---|---|
| Open | Silva Maria Da E | $101,000 | |
| Closed | Silva Maria Da E | $80,000 | |
| Closed | Silva Maria Da E | $55,000 |
Source: Public Records
Tax History
| Year | Tax Paid | Tax Assessment Tax Assessment Total Assessment is a certain percentage of the fair market value that is determined by local assessors to be the total taxable value of land and additions on the property. | Land | Improvement |
|---|---|---|---|---|
| 2025 | $6,948 | $531,600 | $140,200 | $391,400 |
| 2024 | $5,973 | $389,600 | $116,800 | $272,800 |
| 2023 | $5,750 | $389,600 | $116,800 | $272,800 |
| 2022 | $5,576 | $255,100 | $62,700 | $192,400 |
| 2021 | $5,485 | $255,100 | $61,400 | $193,700 |
| 2020 | $5,253 | $255,100 | $61,400 | $193,700 |
| 2019 | $5,107 | $255,100 | $61,400 | $193,700 |
| 2018 | $5,171 | $226,000 | $59,900 | $166,100 |
| 2017 | $5,056 | $226,000 | $59,900 | $166,100 |
| 2016 | $5,031 | $226,000 | $59,900 | $166,100 |
| 2015 | $4,898 | $213,400 | $55,500 | $157,900 |
| 2014 | $4,898 | $213,400 | $55,500 | $157,900 |
Source: Public Records
Map
Nearby Homes
- 25 Winslow St
- 14 Benedict St
- 14 Winthrop St
- 15 Plaza Dr
- 85 Hilton Ave
- 103 Burnside Ave
- 23 Albert Ave
- 6 Hazelton Rd
- 15 Claire St
- 25 Arnold St
- 10 Booth Ave
- 65 Estrell Dr
- 151 Willett Ave Unit 2
- 33 Pine St Unit 35
- 72 Stowe Ave
- 45 Washington Rd
- 28 Jefferson Ave
- 41 White Ave
- 7 Jill Ct
- 43 Bullocks Point Ave Unit 4A
Your Personal Tour Guide
Ask me questions while you tour the home.