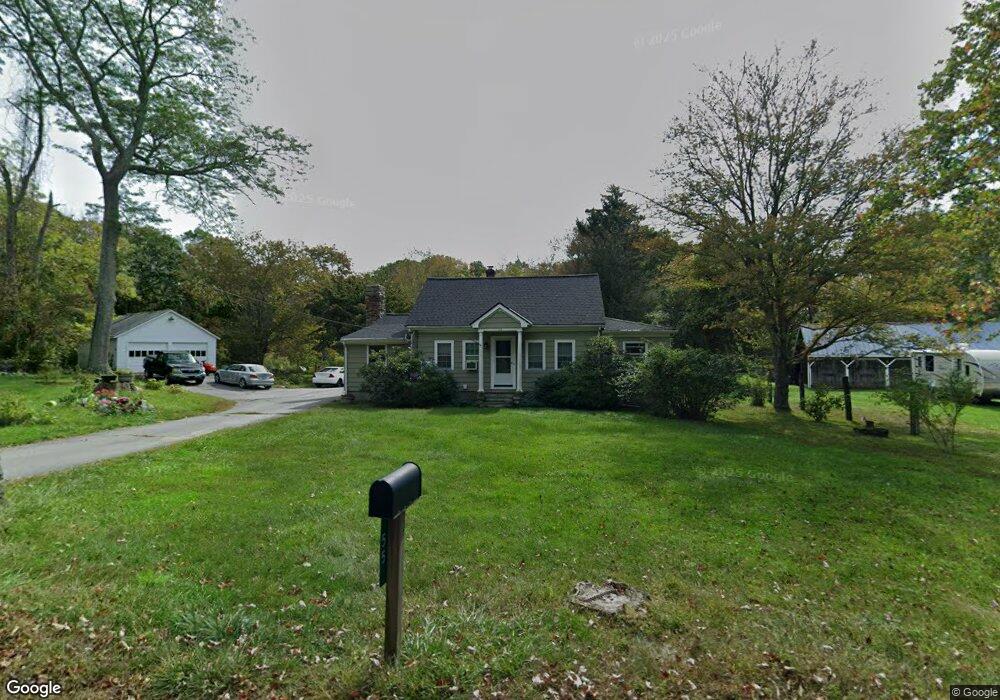
55 Brook St Rehoboth, MA 02769
Estimated Value: $458,000 - $580,000
1
Bed
1
Bath
1,464
Sq Ft
$346/Sq Ft
Est. Value
About This Home
This home is located at 55 Brook St, Rehoboth, MA 02769 and is currently estimated at $506,093, approximately $345 per square foot. 55 Brook St is a home located in Bristol County with nearby schools including Dighton-Rehoboth Regional High School and Cedar Brook School.
Ownership History
Date
Name
Owned For
Owner Type
Purchase Details
Closed on
Feb 9, 2004
Sold by
Holden John T and Stanhope Susann M
Bought by
Holden John T and Stanhope Susann M
Current Estimated Value
Purchase Details
Closed on
May 10, 2002
Sold by
Humes Martin S and Humes William R
Bought by
Holden John T and Stanhope Susann M
Home Financials for this Owner
Home Financials are based on the most recent Mortgage that was taken out on this home.
Original Mortgage
$120,000
Interest Rate
7.18%
Mortgage Type
Purchase Money Mortgage
Create a Home Valuation Report for This Property
The Home Valuation Report is an in-depth analysis detailing your home's value as well as a comparison with similar homes in the area
Home Values in the Area
Average Home Value in this Area
Purchase History
| Date | Buyer | Sale Price | Title Company |
|---|---|---|---|
| Holden John T | -- | -- | |
| Holden John T | $150,000 | -- |
Source: Public Records
Mortgage History
| Date | Status | Borrower | Loan Amount |
|---|---|---|---|
| Previous Owner | Holden John T | $120,000 |
Source: Public Records
Tax History
| Year | Tax Paid | Tax Assessment Tax Assessment Total Assessment is a certain percentage of the fair market value that is determined by local assessors to be the total taxable value of land and additions on the property. | Land | Improvement |
|---|---|---|---|---|
| 2025 | $42 | $372,600 | $194,100 | $178,500 |
| 2024 | $3,959 | $348,500 | $194,100 | $154,400 |
| 2023 | $3,963 | $342,200 | $190,100 | $152,100 |
| 2022 | $3,821 | $301,600 | $181,700 | $119,900 |
| 2021 | $3,777 | $285,300 | $165,400 | $119,900 |
| 2020 | $0 | $281,900 | $165,400 | $116,500 |
| 2018 | $3,158 | $261,600 | $157,600 | $104,000 |
| 2017 | $3,135 | $249,600 | $157,600 | $92,000 |
| 2016 | $2,989 | $246,000 | $157,600 | $88,400 |
| 2015 | $3,041 | $247,000 | $150,400 | $96,600 |
| 2014 | $2,908 | $233,800 | $143,200 | $90,600 |
Source: Public Records
Map
Nearby Homes
Your Personal Tour Guide
Ask me questions while you tour the home.