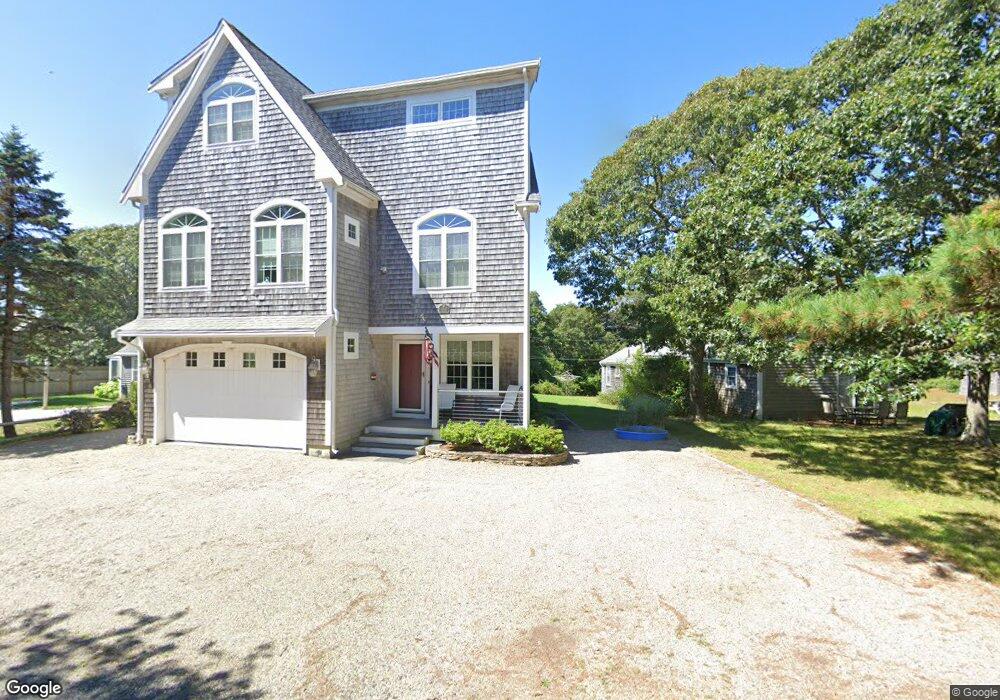
55 Caleb St West Harwich, MA 02671
Dennis Port NeighborhoodEstimated Value: $617,000 - $1,108,028
3
Beds
3
Baths
2,708
Sq Ft
$294/Sq Ft
Est. Value
About This Home
This home is located at 55 Caleb St, West Harwich, MA 02671 and is currently estimated at $795,343, approximately $293 per square foot. 55 Caleb St is a home located in Barnstable County with nearby schools including Dennis-Yarmouth Regional High School and St. Pius X. School.
Ownership History
Date
Name
Owned For
Owner Type
Purchase Details
Closed on
Jan 19, 2012
Sold by
Us Bank Na
Bought by
Starfish Rt
Current Estimated Value
Purchase Details
Closed on
Oct 13, 2011
Sold by
Goodhall Ruth C and Us Bank Na
Bought by
Us Bank Na
Purchase Details
Closed on
Feb 22, 2002
Sold by
Bank One Natl Assoc
Bought by
Co Ri Rt
Purchase Details
Closed on
May 13, 1999
Sold by
Chandonait Peter J
Bought by
Webby John M
Home Financials for this Owner
Home Financials are based on the most recent Mortgage that was taken out on this home.
Original Mortgage
$80,000
Interest Rate
6.92%
Mortgage Type
Purchase Money Mortgage
Create a Home Valuation Report for This Property
The Home Valuation Report is an in-depth analysis detailing your home's value as well as a comparison with similar homes in the area
Home Values in the Area
Average Home Value in this Area
Purchase History
| Date | Buyer | Sale Price | Title Company |
|---|---|---|---|
| Starfish Rt | $425,000 | -- | |
| Us Bank Na | $569,900 | -- | |
| Us Bank Na | $569,900 | -- | |
| Co Ri Rt | $123,000 | -- | |
| Co Ri Rt | $123,000 | -- | |
| Webby John M | $100,000 | -- | |
| Webby John M | $100,000 | -- |
Source: Public Records
Mortgage History
| Date | Status | Borrower | Loan Amount |
|---|---|---|---|
| Previous Owner | Webby John M | $80,000 |
Source: Public Records
Tax History Compared to Growth
Tax History
| Year | Tax Paid | Tax Assessment Tax Assessment Total Assessment is a certain percentage of the fair market value that is determined by local assessors to be the total taxable value of land and additions on the property. | Land | Improvement |
|---|---|---|---|---|
| 2025 | $4,325 | $998,800 | $274,000 | $724,800 |
| 2024 | $4,372 | $996,000 | $263,500 | $732,500 |
| 2023 | $4,262 | $912,700 | $239,500 | $673,200 |
| 2022 | $3,701 | $660,900 | $188,800 | $472,100 |
| 2021 | $3,582 | $594,000 | $185,100 | $408,900 |
| 2020 | $3,223 | $528,300 | $185,100 | $343,200 |
| 2019 | $3,007 | $487,300 | $197,000 | $290,300 |
| 2018 | $11,082 | $481,000 | $187,600 | $293,400 |
| 2017 | $3,069 | $499,100 | $172,700 | $326,400 |
| 2016 | $2,876 | $440,400 | $162,900 | $277,500 |
| 2015 | $2,819 | $440,400 | $162,900 | $277,500 |
| 2014 | $2,793 | $439,800 | $153,000 | $286,800 |
Source: Public Records
Map
Nearby Homes
- 1 E Belmont Unit 630
- 1 Belmont Rd Unit 630
- 1 Belmont Rd Unit 513
- 11 Ocean Park W
- 9 Chase Ave Unit 6
- 3 Fairbanks Dr
- 26 Manning Rd
- 405 Old Wharf Rd Unit B204
- 405 Old Wharf Rd Unit B204
- 402 Old Wharf Rd
- 402 Old Wharf Rd
- 19 Riverway
- 159 Center St Unit 22
- 19 Riverway
- 12 Cross St
- 73 Division St
- 148 Belmont Rd
- 24 Chase St
- 102 Sea St
- 24 Chase St
- 36 Belmont Rd Unit N1
- 36 Belmont Rd Unit E-1
- 36 Belmont Rd Unit W-1
- 36 Belmont Rd
- 36 Belmont Rd Unit SW-2
- 36 Belmont Rd Unit W2
- 36 Belmont Rd Unit W22
- 36 Belmont Rd Unit S21
- 36 Belmont Rd Unit N21
- 36 Belmont Rd Unit SW 21
- 36 Belmont Rd Unit SW-3
- 36 Belmont Rd Unit E-22
- 36 Belmont Rd Unit U-S22
- 28 Caleb St
- 36 Belmont Rd Unit E22
- 36 Belmont Rd Unit N1
- 36 Belmont Rd Unit SW2
- 36 Belmont Rd Unit W22
- 36 Belmont Rd Unit W2
- 36 Belmont Rd Unit N21