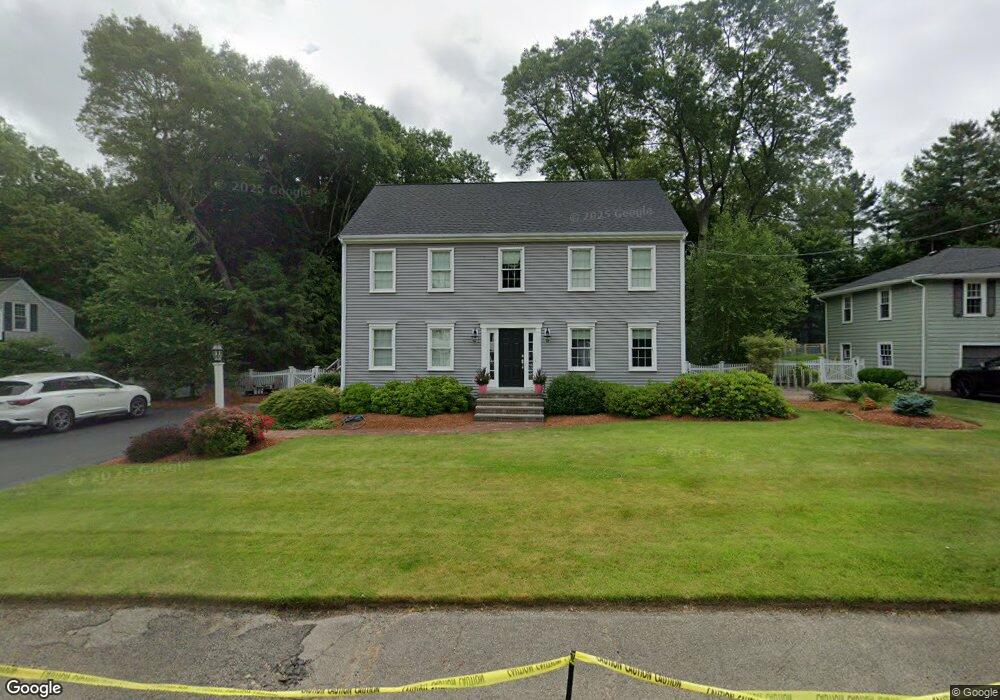
55 Carpenter Rd Walpole, MA 02081
Estimated Value: $663,000 - $765,000
2
Beds
1
Bath
1,900
Sq Ft
$378/Sq Ft
Est. Value
About This Home
This home is located at 55 Carpenter Rd, Walpole, MA 02081 and is currently estimated at $718,739, approximately $378 per square foot. 55 Carpenter Rd is a home located in Norfolk County with nearby schools including Boyden School, Eleanor N. Johnson Middle School, and Walpole High School.
Ownership History
Date
Name
Owned For
Owner Type
Purchase Details
Closed on
Jan 28, 2005
Sold by
Merrikin Cynthia A and Merrikin Daniel J
Bought by
55 Carpenter Road Rt and Merrikin Cynthia A
Current Estimated Value
Purchase Details
Closed on
Dec 29, 1997
Sold by
Hanley Walter E and Hanley Gertrude T
Bought by
Merrikin Daniel J and Merikin Cynthia A
Home Financials for this Owner
Home Financials are based on the most recent Mortgage that was taken out on this home.
Original Mortgage
$146,250
Interest Rate
7.15%
Mortgage Type
Purchase Money Mortgage
Create a Home Valuation Report for This Property
The Home Valuation Report is an in-depth analysis detailing your home's value as well as a comparison with similar homes in the area
Home Values in the Area
Average Home Value in this Area
Purchase History
| Date | Buyer | Sale Price | Title Company |
|---|---|---|---|
| 55 Carpenter Road Rt | -- | -- | |
| Merrikin Daniel J | $162,500 | -- |
Source: Public Records
Mortgage History
| Date | Status | Borrower | Loan Amount |
|---|---|---|---|
| Previous Owner | Merrikin Daniel J | $153,700 | |
| Previous Owner | Merrikin Daniel J | $146,250 | |
| Previous Owner | Merrikin Daniel J | $80,000 |
Source: Public Records
Tax History
| Year | Tax Paid | Tax Assessment Tax Assessment Total Assessment is a certain percentage of the fair market value that is determined by local assessors to be the total taxable value of land and additions on the property. | Land | Improvement |
|---|---|---|---|---|
| 2025 | $8,771 | $683,600 | $353,200 | $330,400 |
| 2024 | $8,518 | $644,300 | $339,600 | $304,700 |
| 2023 | $8,174 | $588,500 | $295,300 | $293,200 |
| 2022 | $7,690 | $531,800 | $273,500 | $258,300 |
| 2021 | $7,337 | $494,400 | $258,000 | $236,400 |
| 2020 | $7,194 | $479,900 | $243,400 | $236,500 |
| 2019 | $6,922 | $458,400 | $234,100 | $224,300 |
| 2018 | $6,595 | $431,900 | $225,900 | $206,000 |
| 2017 | $6,402 | $417,600 | $217,200 | $200,400 |
| 2016 | $6,226 | $400,100 | $208,800 | $191,300 |
| 2015 | $6,041 | $384,800 | $199,000 | $185,800 |
| 2014 | $5,809 | $368,600 | $199,000 | $169,600 |
Source: Public Records
Map
Nearby Homes
- 37 Alice Ave
- 6 Eleanor Rd
- 587 Common St
- 145 South St Unit 5
- 635 Old Post Rd Unit 303
- 635 Old Post Rd Unit 302
- 635 Old Post Rd Unit 210
- 635 Old Post Rd Unit 2-203
- 50 Riverside Place
- 224 School St Unit 9
- 222 School St Unit 9
- 1110 Main St
- 0 U S Route 1
- 1391 Main St Unit 308
- 1391 Main St Unit 306
- 1391 Main St Unit 304
- 26 Drake Cir
- 881 Main St Unit 9
- 1 Palace Ct
- 3 Stone Hill Terrace
- 63 Carpenter Rd
- 47 Carpenter Rd
- 1107 Washington St
- 71 Carpenter Rd
- 39 Carpenter Rd
- 1111 Washington St
- 54 Carpenter Rd
- 62 Carpenter Rd
- 46 Carpenter Rd
- 70 Carpenter Rd
- 79 Carpenter Rd
- 31 Carpenter Rd
- 1135 Washington St
- 38 Carpenter Rd
- 1093 Washington St
- 78 Carpenter Rd
- 1137 Washington St
- 30 Carpenter Rd
- 18 Bonney Rd
- 87 Carpenter Rd
Your Personal Tour Guide
Ask me questions while you tour the home.