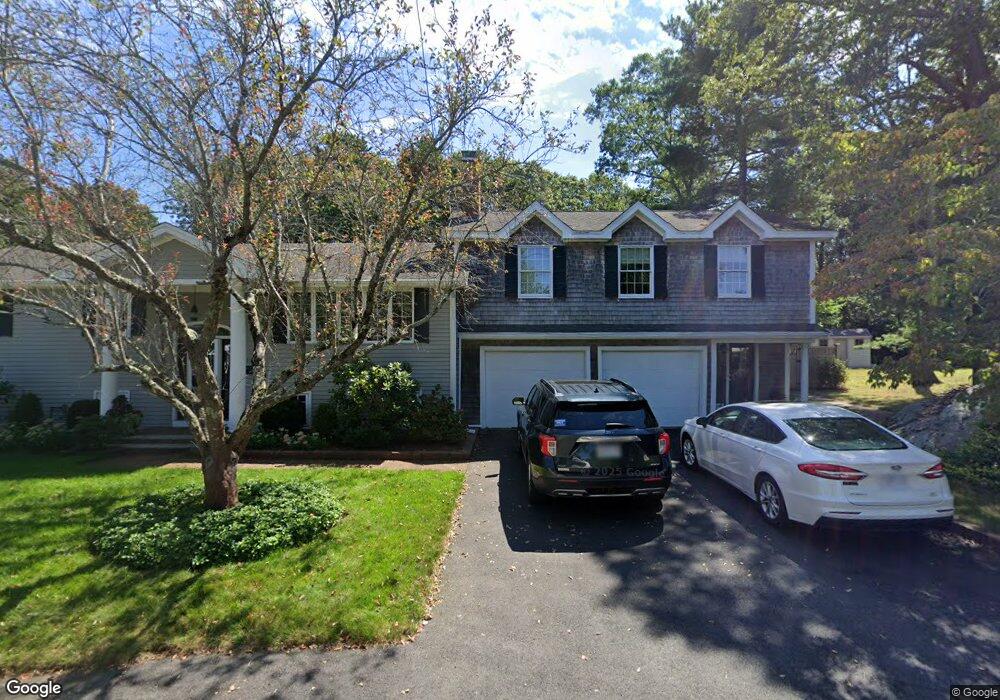
55 Cassandra Rd East Weymouth, MA 02189
East Weymouth NeighborhoodEstimated Value: $742,000 - $946,097
--
Bed
4
Baths
2,829
Sq Ft
$310/Sq Ft
Est. Value
About This Home
This home is located at 55 Cassandra Rd, East Weymouth, MA 02189 and is currently estimated at $876,024, approximately $309 per square foot. 55 Cassandra Rd is a home located in Norfolk County with nearby schools including Abigail Adams Middle School, Weymouth Middle School Chapman, and Weymouth High School.
Ownership History
Date
Name
Owned For
Owner Type
Purchase Details
Closed on
May 10, 2001
Sold by
Bristol James E
Bought by
Haley Paul R and Haley Jacqueline H
Current Estimated Value
Home Financials for this Owner
Home Financials are based on the most recent Mortgage that was taken out on this home.
Original Mortgage
$98,000
Outstanding Balance
$36,187
Interest Rate
6.88%
Mortgage Type
Purchase Money Mortgage
Estimated Equity
$839,837
Purchase Details
Closed on
Sep 29, 1995
Sold by
Renahan Richard H and Renahan Elizabeth E
Bought by
Haley Paul R and Haley Jacqueline H
Home Financials for this Owner
Home Financials are based on the most recent Mortgage that was taken out on this home.
Original Mortgage
$117,600
Interest Rate
7.89%
Mortgage Type
Purchase Money Mortgage
Create a Home Valuation Report for This Property
The Home Valuation Report is an in-depth analysis detailing your home's value as well as a comparison with similar homes in the area
Home Values in the Area
Average Home Value in this Area
Purchase History
| Date | Buyer | Sale Price | Title Company |
|---|---|---|---|
| Haley Paul R | $140,000 | -- | |
| Haley Paul R | $222,000 | -- |
Source: Public Records
Mortgage History
| Date | Status | Borrower | Loan Amount |
|---|---|---|---|
| Open | Haley Paul R | $98,000 | |
| Previous Owner | Haley Paul R | $171,000 | |
| Previous Owner | Haley Paul R | $117,600 | |
| Closed | Haley Paul R | $42,700 |
Source: Public Records
Tax History Compared to Growth
Tax History
| Year | Tax Paid | Tax Assessment Tax Assessment Total Assessment is a certain percentage of the fair market value that is determined by local assessors to be the total taxable value of land and additions on the property. | Land | Improvement |
|---|---|---|---|---|
| 2025 | $10,161 | $1,006,000 | $217,700 | $788,300 |
| 2024 | $9,943 | $968,200 | $207,400 | $760,800 |
| 2023 | $9,817 | $939,400 | $192,000 | $747,400 |
| 2022 | $9,532 | $831,800 | $177,800 | $654,000 |
| 2021 | $9,400 | $800,700 | $177,800 | $622,900 |
| 2020 | $9,238 | $775,000 | $177,800 | $597,200 |
| 2019 | $9,086 | $749,700 | $171,000 | $578,700 |
| 2018 | $8,828 | $706,200 | $162,800 | $543,400 |
| 2017 | $8,698 | $679,000 | $155,100 | $523,900 |
| 2016 | $8,358 | $653,000 | $149,100 | $503,900 |
| 2015 | $7,854 | $608,800 | $149,100 | $459,700 |
| 2014 | $7,593 | $570,900 | $138,800 | $432,100 |
Source: Public Records
Map
Nearby Homes
- 124 Charles Diersch St
- 86 Black Rock Dr
- 955 Pleasant St Unit 11
- 14 Old Stone Way Unit 11
- 1297 Pleasant St
- 131 Mutton Ln
- 10 Chapman St Unit 205
- 10 Chapman St Unit 202
- 17 Grove St
- 38 School St Unit 2
- 16 Oak Cliff Rd
- 2 Black Rock Dr Unit 21
- 2 Black Rock Dr
- 10 Duck Ln
- 1015 Washington St
- 966 Washington St Unit 2
- 249 High St
- 209 Lake St Unit 69
- 209 Lake Shore Dr
- 211 Lake Shore Dr