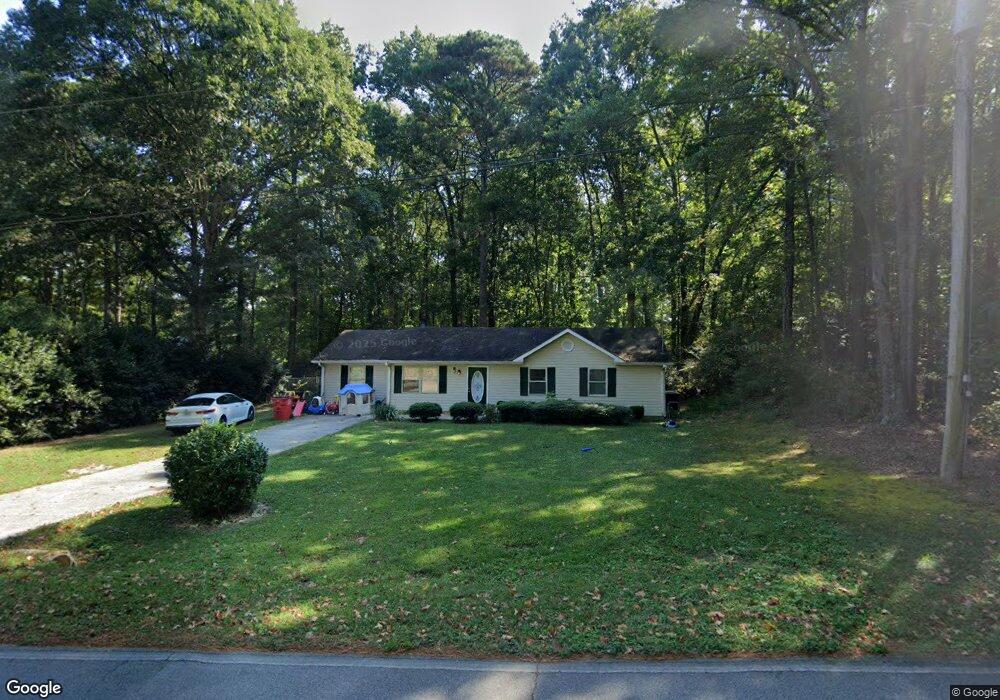
55 Cedar Heights Rd Carrollton, GA 30116
Estimated Value: $226,000 - $259,000
3
Beds
2
Baths
1,416
Sq Ft
$172/Sq Ft
Est. Value
About This Home
This home is located at 55 Cedar Heights Rd, Carrollton, GA 30116 and is currently estimated at $243,121, approximately $171 per square foot. 55 Cedar Heights Rd is a home located in Carroll County with nearby schools including Central Elementary School, Central Middle School, and Central High School.
Ownership History
Date
Name
Owned For
Owner Type
Purchase Details
Closed on
Jan 31, 2013
Sold by
Perrine Eddie R
Bought by
Perrine Eddy R and Perrine Sandy
Current Estimated Value
Home Financials for this Owner
Home Financials are based on the most recent Mortgage that was taken out on this home.
Original Mortgage
$61,400
Outstanding Balance
$42,803
Interest Rate
3.35%
Mortgage Type
New Conventional
Estimated Equity
$200,318
Purchase Details
Closed on
Nov 23, 2009
Sold by
Perrine Sandy
Bought by
Perrine Eddy R
Purchase Details
Closed on
Aug 26, 2005
Sold by
Craven Michael D
Bought by
Gamble Bobby
Purchase Details
Closed on
May 14, 2003
Sold by
Collins Sandra M
Bought by
Perrine Eddy R and Perrine Sandy
Purchase Details
Closed on
Mar 16, 1998
Sold by
Collins Timothy & Sa
Bought by
Collins Sandra M
Purchase Details
Closed on
Jun 26, 1996
Sold by
Collins
Bought by
Collins Timothy & Sa
Purchase Details
Closed on
Oct 1, 1987
Bought by
Collins
Create a Home Valuation Report for This Property
The Home Valuation Report is an in-depth analysis detailing your home's value as well as a comparison with similar homes in the area
Home Values in the Area
Average Home Value in this Area
Purchase History
| Date | Buyer | Sale Price | Title Company |
|---|---|---|---|
| Perrine Eddy R | -- | -- | |
| Perrine Eddy R | -- | -- | |
| Gamble Bobby | $83,000 | -- | |
| Perrine Eddy R | -- | -- | |
| Collins Sandra M | -- | -- | |
| Collins Timothy & Sa | -- | -- | |
| Collins | -- | -- |
Source: Public Records
Mortgage History
| Date | Status | Borrower | Loan Amount |
|---|---|---|---|
| Open | Perrine Eddy R | $61,400 |
Source: Public Records
Tax History Compared to Growth
Tax History
| Year | Tax Paid | Tax Assessment Tax Assessment Total Assessment is a certain percentage of the fair market value that is determined by local assessors to be the total taxable value of land and additions on the property. | Land | Improvement |
|---|---|---|---|---|
| 2024 | $1,416 | $62,581 | $8,000 | $54,581 |
| 2023 | $1,416 | $57,720 | $8,000 | $49,720 |
| 2022 | $1,200 | $47,836 | $8,000 | $39,836 |
| 2021 | $1,083 | $42,256 | $8,000 | $34,256 |
| 2020 | $995 | $38,760 | $8,000 | $30,760 |
| 2019 | $937 | $36,195 | $8,000 | $28,195 |
| 2018 | $856 | $32,606 | $8,000 | $24,606 |
| 2017 | $859 | $32,606 | $8,000 | $24,606 |
| 2016 | $859 | $32,606 | $8,000 | $24,606 |
| 2015 | $687 | $24,570 | $4,000 | $20,570 |
| 2014 | $690 | $24,570 | $4,000 | $20,570 |
Source: Public Records
Map
Nearby Homes
- 420 Whooping Creek Rd
- 977 Whooping Creek Rd
- 605 Whooping Creek Rd
- 587 Whooping Creek Rd
- 50 Azalea Trail
- 135 Gray Rd
- 400 Stripling Chapel Rd
- 703 Central High Rd
- 50 Sue Alice Ln
- Plan 1643 at Windmill Park
- Plan 1830 at Windmill Park
- 203 Vineyard Walk Unit LOT 74
- Plan 2030 at Windmill Park
- 203 Vineyard Walk
- Plan 1727 at Windmill Park
- Plan 1400 at Windmill Park
- 113 Vineyard Walk
- 113 Vineyard Walk Unit LOT 77
- 111 Vineyard Walk
- 111 Vineyard Walk Unit LOT 78
- 116 Cedar Heights Rd
- 245 Whooping Creek Rd
- 255 Whooping Creek Rd
- 227 Whooping Creek Rd
- 270 Whooping Creek Rd
- 285 Whooping Creek Rd
- 19 Cedar Heights Rd
- 200 Whooping Creek Rd
- 000 Whooping Creek Rd
- 00 Whooping Creek Rd
- 273 Whooping Creek Rd
- 280 Whooping Creek Rd
- 277 Whooping Creek Rd
- 190 Whooping Creek Rd
- 312 Whooping Creek Rd
- 312 Whooping Creek Rd
- 278 Whooping Creek Rd
- 180 Whooping Creek Rd
- 272 Whooping Creek Rd
- 0 Whooping Creek Rd