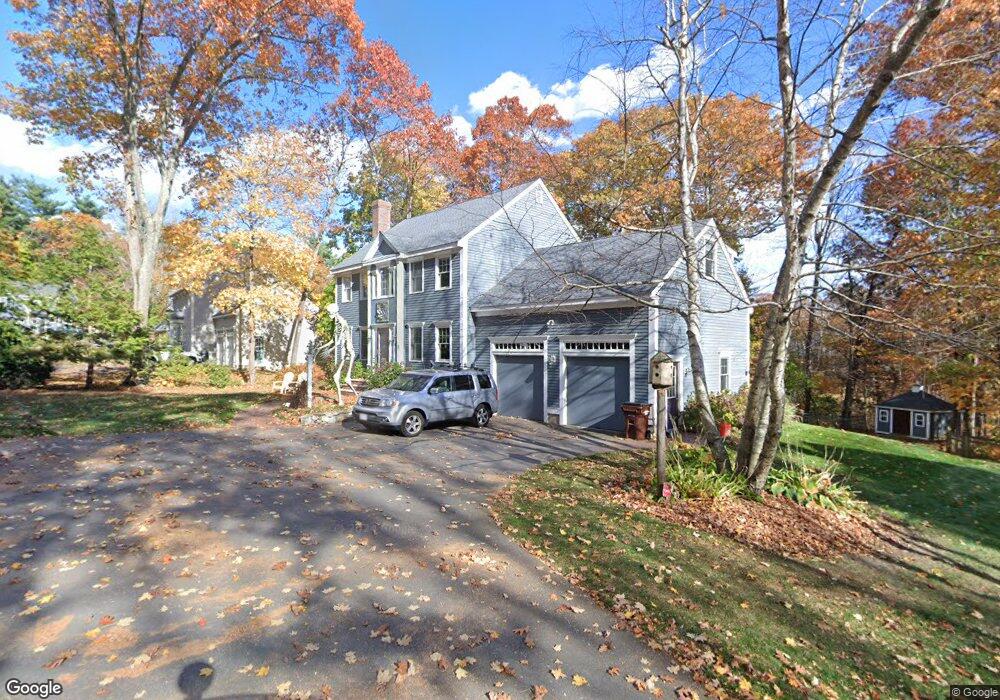
55 Cedar St Amesbury, MA 01913
Estimated Value: $808,000 - $956,000
4
Beds
3
Baths
2,328
Sq Ft
$379/Sq Ft
Est. Value
About This Home
This home is located at 55 Cedar St, Amesbury, MA 01913 and is currently estimated at $882,591, approximately $379 per square foot. 55 Cedar St is a home located in Essex County with nearby schools including Amesbury High School and Amesbury Seventh-Day Adventist School.
Ownership History
Date
Name
Owned For
Owner Type
Purchase Details
Closed on
Jun 20, 1997
Sold by
M&J Rt and Wojcicki Mark E
Bought by
Tripp Kenneth J and Tripp Tara J
Current Estimated Value
Home Financials for this Owner
Home Financials are based on the most recent Mortgage that was taken out on this home.
Original Mortgage
$218,900
Interest Rate
7.87%
Mortgage Type
Purchase Money Mortgage
Create a Home Valuation Report for This Property
The Home Valuation Report is an in-depth analysis detailing your home's value as well as a comparison with similar homes in the area
Home Values in the Area
Average Home Value in this Area
Purchase History
| Date | Buyer | Sale Price | Title Company |
|---|---|---|---|
| Tripp Kenneth J | $243,250 | -- |
Source: Public Records
Mortgage History
| Date | Status | Borrower | Loan Amount |
|---|---|---|---|
| Open | Tripp Kenneth J | $127,000 | |
| Open | Tripp Kenneth J | $245,000 | |
| Closed | Tripp Kenneth J | $218,900 |
Source: Public Records
Tax History
| Year | Tax Paid | Tax Assessment Tax Assessment Total Assessment is a certain percentage of the fair market value that is determined by local assessors to be the total taxable value of land and additions on the property. | Land | Improvement |
|---|---|---|---|---|
| 2025 | $12,414 | $811,400 | $298,100 | $513,300 |
| 2024 | $11,835 | $756,700 | $281,200 | $475,500 |
| 2023 | $10,820 | $662,200 | $244,500 | $417,700 |
| 2022 | $10,591 | $598,700 | $212,900 | $385,800 |
| 2021 | $10,081 | $552,400 | $169,800 | $382,600 |
| 2020 | $9,042 | $526,300 | $163,400 | $362,900 |
| 2019 | $9,163 | $498,800 | $163,400 | $335,400 |
| 2018 | $8,483 | $446,700 | $155,500 | $291,200 |
| 2017 | $8,704 | $436,300 | $155,500 | $280,800 |
| 2016 | $8,479 | $418,100 | $155,500 | $262,600 |
| 2015 | $8,321 | $405,100 | $155,500 | $249,600 |
| 2014 | $8,113 | $386,900 | $155,500 | $231,400 |
Source: Public Records
Map
Nearby Homes
- 25 Cedar St Unit 4
- 21 Congress St
- 97 Elm St
- 105 Market St Unit B
- 101 Market St Unit B
- 5 Russell St Unit 1
- 4 Clark St
- 149 Market St
- 3 Tremont Ave Unit A
- 48 Orchard St
- 21 River St
- 82 Monroe St
- 4 Greenwood St
- 25 Whittier Meadows Dr
- 1 Hillside Ave Unit 3
- 253 Main St
- 9 Elmwood St
- 382 Main St
- 3 Birchwood Point Unit 202
- 53 Rabbit Rd
- 57 Cedar St
- 53 Cedar St
- 59 Cedar St
- 51 Cedar St
- 8 Maplewood Ave
- 49 Cedar St
- 61 Cedar St
- 6 Maplewood Ave Unit 6
- 6 Maplewood Ave Unit 2
- 7 Maplewood Ave
- 6 Maplewood Ave
- 10 Maplewood Ave
- 4 Maplewood Ave
- 9 Maplewood Ave
- 9 Maplewood Ave Unit 1
- 78 Cedar St
- 63 Cedar St
- 3 Maplewood Ave
- 3 Maplewood Ave Unit 2
- 3 Maplewood Ave Unit B
Your Personal Tour Guide
Ask me questions while you tour the home.