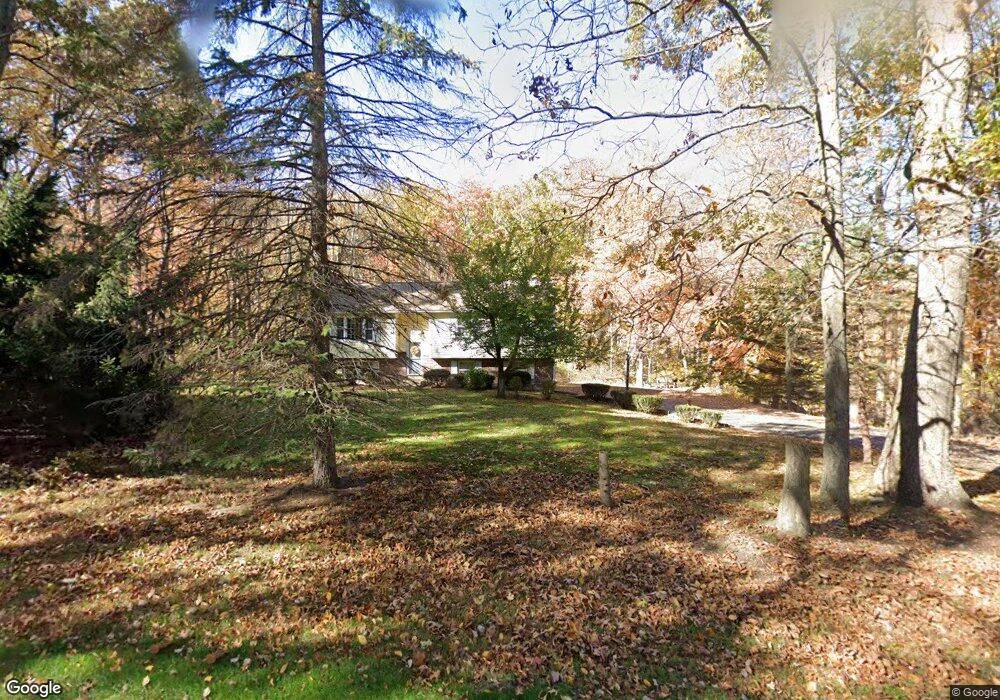
55 Chestnut St Hopkinton, MA 01748
Estimated Value: $693,060 - $823,000
3
Beds
2
Baths
1,750
Sq Ft
$420/Sq Ft
Est. Value
About This Home
This home is located at 55 Chestnut St, Hopkinton, MA 01748 and is currently estimated at $735,265, approximately $420 per square foot. 55 Chestnut St is a home located in Middlesex County with nearby schools including Marathon Elementary School, Hopkins Elementary School, and Elmwood Elementary School.
Ownership History
Date
Name
Owned For
Owner Type
Purchase Details
Closed on
Dec 1, 2005
Sold by
Correia Jean K and Steeves Jean K
Bought by
Mcmillan Jacquelin D
Current Estimated Value
Home Financials for this Owner
Home Financials are based on the most recent Mortgage that was taken out on this home.
Original Mortgage
$160,000
Outstanding Balance
$88,722
Interest Rate
6.14%
Mortgage Type
Purchase Money Mortgage
Estimated Equity
$646,543
Purchase Details
Closed on
Nov 10, 1989
Sold by
Colangelo Anthony J
Bought by
Steeves Jeaan K
Home Financials for this Owner
Home Financials are based on the most recent Mortgage that was taken out on this home.
Original Mortgage
$151,200
Interest Rate
10.03%
Mortgage Type
Purchase Money Mortgage
Create a Home Valuation Report for This Property
The Home Valuation Report is an in-depth analysis detailing your home's value as well as a comparison with similar homes in the area
Home Values in the Area
Average Home Value in this Area
Purchase History
| Date | Buyer | Sale Price | Title Company |
|---|---|---|---|
| Mcmillan Jacquelin D | $367,000 | -- | |
| Steeves Jeaan K | $168,000 | -- |
Source: Public Records
Mortgage History
| Date | Status | Borrower | Loan Amount |
|---|---|---|---|
| Open | Mcmillan Jacquelin D | $160,000 | |
| Previous Owner | Steeves Jeaan K | $135,000 | |
| Previous Owner | Steeves Jeaan K | $148,000 | |
| Previous Owner | Steeves Jeaan K | $151,200 |
Source: Public Records
Tax History Compared to Growth
Tax History
| Year | Tax Paid | Tax Assessment Tax Assessment Total Assessment is a certain percentage of the fair market value that is determined by local assessors to be the total taxable value of land and additions on the property. | Land | Improvement |
|---|---|---|---|---|
| 2025 | $7,925 | $558,900 | $291,000 | $267,900 |
| 2024 | $7,808 | $534,400 | $277,000 | $257,400 |
| 2023 | $7,567 | $478,600 | $243,100 | $235,500 |
| 2022 | $7,411 | $435,200 | $220,800 | $214,400 |
| 2021 | $7,196 | $421,300 | $214,200 | $207,100 |
| 2020 | $6,876 | $408,800 | $209,300 | $199,500 |
| 2019 | $6,633 | $386,300 | $205,200 | $181,100 |
| 2018 | $6,287 | $372,000 | $195,300 | $176,700 |
| 2017 | $5,799 | $345,200 | $189,500 | $155,700 |
| 2016 | $5,739 | $337,000 | $185,800 | $151,200 |
| 2015 | $5,806 | $323,300 | $180,400 | $142,900 |
Source: Public Records
Map
Nearby Homes
- 180 Ash St
- 11 Kimball Rd
- 5 Myrtle Ave Unit 2
- 7 Myrtle Ave Unit 3
- 10 Oak St
- 20 Davenport Ln Unit 20
- 52 S Mill St
- 13 Fitch Ave
- 13 Fitch Ave Unit 19
- 16 Fitch Ave Unit 6
- 7 Davenport Ln Unit 7
- 11 Fitch Ave Unit 18
- 14 Fitch Ave Unit 7
- 12 Fitch Ave Unit 8
- 10 Fitch Ave Unit 9
- Stockbridge Plan at Newbury Glen
- Williamstown Plan at Newbury Glen
- Silverbrook Plan at Newbury Glen
- Dickinson Plan at Newbury Glen
- Copley Plan at Newbury Glen