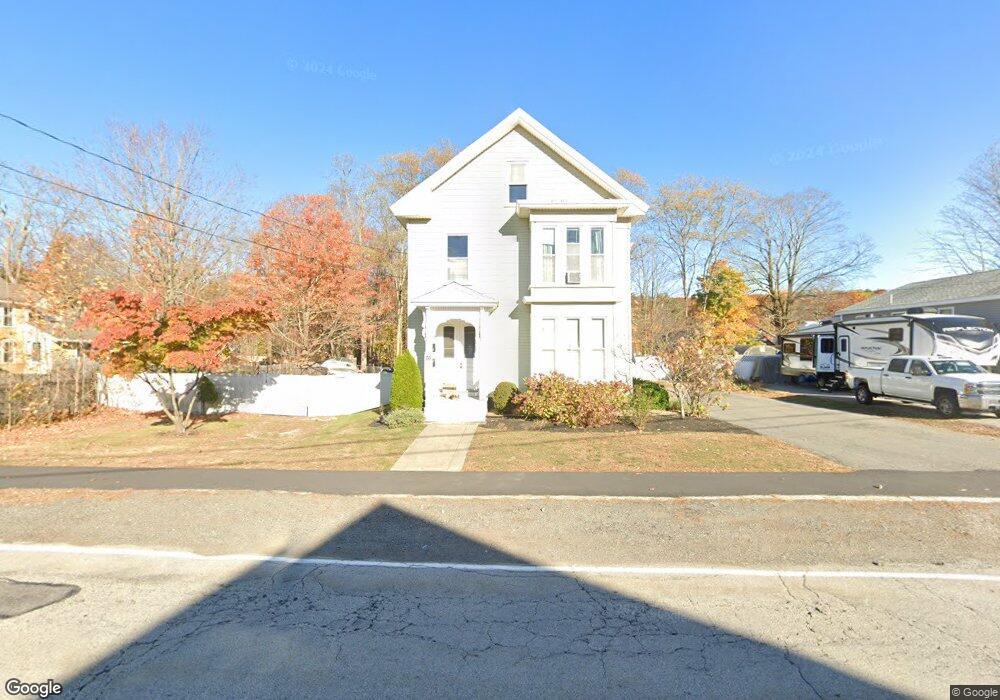
55 Church St Merrimac, MA 01860
Estimated Value: $592,000 - $733,000
5
Beds
2
Baths
2,973
Sq Ft
$229/Sq Ft
Est. Value
About This Home
This home is located at 55 Church St, Merrimac, MA 01860 and is currently estimated at $681,562, approximately $229 per square foot. 55 Church St is a home located in Essex County with nearby schools including Pentucket Regional High School.
Ownership History
Date
Name
Owned For
Owner Type
Purchase Details
Closed on
Mar 17, 2020
Sold by
Parry Ft and Camp
Bought by
Parry Philip A
Current Estimated Value
Home Financials for this Owner
Home Financials are based on the most recent Mortgage that was taken out on this home.
Original Mortgage
$198,500
Outstanding Balance
$135,088
Interest Rate
3.4%
Mortgage Type
New Conventional
Estimated Equity
$546,474
Purchase Details
Closed on
Sep 21, 2012
Sold by
Parry Philip A
Bought by
Parry Ft and Parry
Purchase Details
Closed on
Nov 3, 2003
Sold by
Sacco George P and Sacco Janet M
Bought by
Parry Philip A
Home Financials for this Owner
Home Financials are based on the most recent Mortgage that was taken out on this home.
Original Mortgage
$331,500
Interest Rate
6.05%
Mortgage Type
Purchase Money Mortgage
Create a Home Valuation Report for This Property
The Home Valuation Report is an in-depth analysis detailing your home's value as well as a comparison with similar homes in the area
Home Values in the Area
Average Home Value in this Area
Purchase History
| Date | Buyer | Sale Price | Title Company |
|---|---|---|---|
| Parry Philip A | -- | None Available | |
| Parry Ft | -- | -- | |
| Parry Philip A | $390,000 | -- |
Source: Public Records
Mortgage History
| Date | Status | Borrower | Loan Amount |
|---|---|---|---|
| Open | Parry Philip A | $198,500 | |
| Previous Owner | Parry Philip A | $330,000 | |
| Previous Owner | Parry Philip A | $331,500 | |
| Previous Owner | Parry Philip A | $131,000 |
Source: Public Records
Tax History Compared to Growth
Tax History
| Year | Tax Paid | Tax Assessment Tax Assessment Total Assessment is a certain percentage of the fair market value that is determined by local assessors to be the total taxable value of land and additions on the property. | Land | Improvement |
|---|---|---|---|---|
| 2025 | $8,556 | $645,700 | $330,800 | $314,900 |
| 2024 | $7,665 | $567,800 | $312,400 | $255,400 |
| 2023 | $7,680 | $520,000 | $264,600 | $255,400 |
| 2022 | $7,364 | $450,700 | $213,200 | $237,500 |
| 2021 | $7,165 | $439,600 | $194,800 | $244,800 |
| 2020 | $6,541 | $439,600 | $194,800 | $244,800 |
| 2019 | $6,321 | $399,800 | $169,100 | $230,700 |
| 2018 | $6,203 | $393,600 | $158,000 | $235,600 |
| 2017 | $6,011 | $367,900 | $132,300 | $235,600 |
| 2016 | $5,945 | $367,900 | $132,300 | $235,600 |
| 2015 | $5,697 | $350,600 | $132,300 | $218,300 |
| 2014 | $5,453 | $343,200 | $132,300 | $210,900 |
Source: Public Records
Map
Nearby Homes