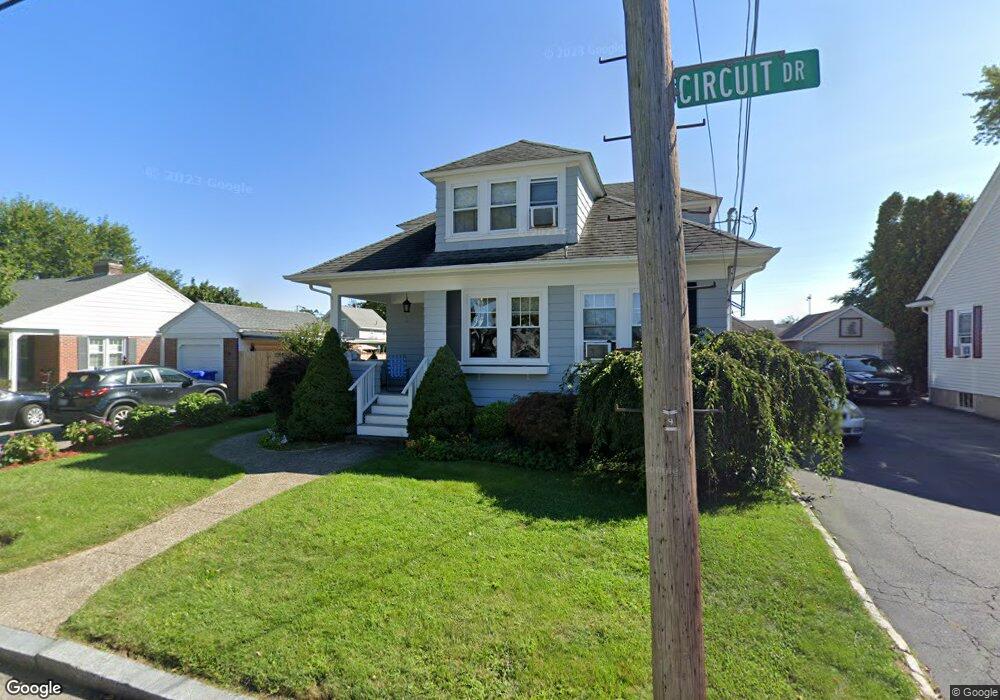
55 Circuit Dr Riverside, RI 02915
Riverside NeighborhoodEstimated Value: $479,398 - $586,000
4
Beds
2
Baths
1,591
Sq Ft
$328/Sq Ft
Est. Value
About This Home
This home is located at 55 Circuit Dr, Riverside, RI 02915 and is currently estimated at $522,100, approximately $328 per square foot. 55 Circuit Dr is a home located in Providence County with nearby schools including East Providence High School, St Mary Academy-Bay View, and St Luke Elementary School.
Ownership History
Date
Name
Owned For
Owner Type
Purchase Details
Closed on
Jan 9, 2026
Sold by
Feeney William A
Bought by
Noonan Zachary
Current Estimated Value
Home Financials for this Owner
Home Financials are based on the most recent Mortgage that was taken out on this home.
Original Mortgage
$265,100
Outstanding Balance
$265,100
Interest Rate
6.23%
Mortgage Type
New Conventional
Estimated Equity
$257,000
Purchase Details
Closed on
Oct 23, 1997
Sold by
Scungio Thomas J and Scungio Jacqueline
Bought by
Demoura Robert P and Chalue Julie A
Home Financials for this Owner
Home Financials are based on the most recent Mortgage that was taken out on this home.
Original Mortgage
$110,300
Interest Rate
7.48%
Mortgage Type
Purchase Money Mortgage
Create a Home Valuation Report for This Property
The Home Valuation Report is an in-depth analysis detailing your home's value as well as a comparison with similar homes in the area
Home Values in the Area
Average Home Value in this Area
Purchase History
| Date | Buyer | Sale Price | Title Company |
|---|---|---|---|
| Noonan Zachary | $400,000 | -- | |
| Demoura Robert P | $116,500 | -- | |
| Demoura Robert P | $116,500 | -- |
Source: Public Records
Mortgage History
| Date | Status | Borrower | Loan Amount |
|---|---|---|---|
| Open | Noonan Zachary | $265,100 | |
| Previous Owner | Demoura Robert P | $125,000 | |
| Previous Owner | Demoura Robert P | $110,300 |
Source: Public Records
Tax History
| Year | Tax Paid | Tax Assessment Tax Assessment Total Assessment is a certain percentage of the fair market value that is determined by local assessors to be the total taxable value of land and additions on the property. | Land | Improvement |
|---|---|---|---|---|
| 2025 | $6,587 | $504,000 | $118,400 | $385,600 |
| 2024 | $5,474 | $357,100 | $98,700 | $258,400 |
| 2023 | $5,271 | $357,100 | $98,700 | $258,400 |
| 2022 | $5,032 | $230,200 | $57,500 | $172,700 |
| 2021 | $4,949 | $230,200 | $53,900 | $176,300 |
| 2020 | $4,740 | $230,200 | $53,900 | $176,300 |
| 2019 | $4,609 | $230,200 | $53,900 | $176,300 |
| 2018 | $4,388 | $191,800 | $52,400 | $139,400 |
| 2017 | $4,291 | $191,800 | $52,400 | $139,400 |
| 2016 | $4,269 | $191,800 | $52,400 | $139,400 |
| 2015 | $4,168 | $181,600 | $48,500 | $133,100 |
| 2014 | $4,168 | $181,600 | $48,500 | $133,100 |
Source: Public Records
Map
Nearby Homes
- 25 Winslow St
- 14 Benedict St
- 14 Winthrop St
- 103 Burnside Ave
- 15 Plaza Dr
- 85 Hilton Ave
- 151 Willett Ave Unit 2
- 15 Claire St
- 23 Albert Ave
- 10 Booth Ave
- 33 Pine St Unit 35
- 6 Hazelton Rd
- 72 Stowe Ave
- 28 Jefferson Ave
- 65 Estrell Dr
- 41 White Ave
- 43 Bullocks Point Ave Unit 4A
- 25 Bullocks Point Ave Unit 5C
- 33 Bullocks Point Ave Unit 5C
- 45 Washington Rd
Your Personal Tour Guide
Ask me questions while you tour the home.