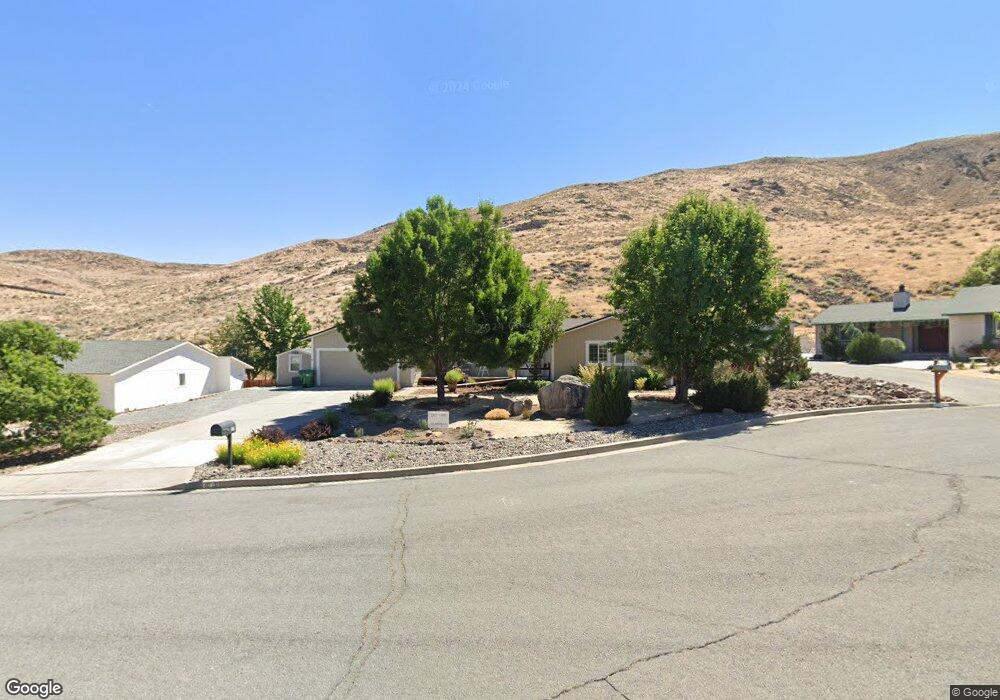
55 Count Fleet Ct Unit 1 Reno, NV 89502
Hidden Valley NeighborhoodEstimated Value: $537,421 - $633,000
4
Beds
2
Baths
1,609
Sq Ft
$369/Sq Ft
Est. Value
About This Home
This home is located at 55 Count Fleet Ct Unit 1, Reno, NV 89502 and is currently estimated at $593,855, approximately $369 per square foot. 55 Count Fleet Ct Unit 1 is a home located in Washoe County with nearby schools including Hidden Valley Elementary School, Edward L Pine Middle School, and Earl Wooster High School.
Ownership History
Date
Name
Owned For
Owner Type
Purchase Details
Closed on
May 16, 2011
Sold by
Rose Robert I and Rose Donna B
Bought by
Rose Robert I and Rose Donna B
Current Estimated Value
Purchase Details
Closed on
Mar 29, 2011
Sold by
Federal National Mortgage Association
Bought by
Rose Robert I and Rose Donna B
Purchase Details
Closed on
Jan 28, 2011
Sold by
Dunbar James T and Dunbar Nancy B
Bought by
Gmac Mortgage Llc
Purchase Details
Closed on
Nov 18, 2010
Sold by
Gmac Mortgage Llc
Bought by
Federal National Mortgage Association
Purchase Details
Closed on
Dec 8, 2005
Sold by
Gregoire Anne Marie
Bought by
Dunbar James T and Dunbar Nancy B
Home Financials for this Owner
Home Financials are based on the most recent Mortgage that was taken out on this home.
Original Mortgage
$346,000
Interest Rate
6.35%
Mortgage Type
Fannie Mae Freddie Mac
Create a Home Valuation Report for This Property
The Home Valuation Report is an in-depth analysis detailing your home's value as well as a comparison with similar homes in the area
Home Values in the Area
Average Home Value in this Area
Purchase History
| Date | Buyer | Sale Price | Title Company |
|---|---|---|---|
| Rose Robert I | -- | None Available | |
| Rose Robert I | $190,000 | Ticor Title Reno | |
| Gmac Mortgage Llc | $219,000 | Pacific Coast Title | |
| Federal National Mortgage Association | -- | Pacific Coast Title | |
| Dunbar James T | $432,500 | Western Title Incorporated |
Source: Public Records
Mortgage History
| Date | Status | Borrower | Loan Amount |
|---|---|---|---|
| Previous Owner | Dunbar James T | $346,000 |
Source: Public Records
Tax History Compared to Growth
Tax History
| Year | Tax Paid | Tax Assessment Tax Assessment Total Assessment is a certain percentage of the fair market value that is determined by local assessors to be the total taxable value of land and additions on the property. | Land | Improvement |
|---|---|---|---|---|
| 2025 | $1,756 | $91,626 | $61,250 | $30,377 |
| 2024 | $1,705 | $84,165 | $52,605 | $31,560 |
| 2023 | $1,705 | $83,123 | $52,605 | $30,518 |
| 2022 | $1,655 | $67,307 | $41,300 | $26,007 |
| 2021 | $1,608 | $58,172 | $31,745 | $26,427 |
| 2020 | $1,564 | $58,762 | $31,745 | $27,017 |
| 2019 | $1,513 | $56,028 | $29,330 | $26,698 |
| 2018 | $1,469 | $48,717 | $22,085 | $26,632 |
| 2017 | $1,427 | $48,249 | $21,105 | $27,144 |
| 2016 | $1,391 | $48,989 | $20,860 | $28,129 |
| 2015 | $350 | $45,825 | $17,605 | $28,220 |
| 2014 | $1,347 | $41,531 | $13,930 | $27,601 |
| 2013 | -- | $41,473 | $13,930 | $27,543 |
Source: Public Records
Map
Nearby Homes
- 2100 Parkway Dr
- 2265 Silky Sullivan Ln
- 2285 Silky Sullivan Ln
- 3690 Sleepy Hollow Dr
- 3477 E Hidden Valley Dr Unit 3
- 3165 W Hidden Valley Dr
- 5595 Saint Andrews Ct
- 5705 Blue Hills Dr
- 5675 E Hidden Valley Dr
- 5409 Greenview Ct
- 2915 Fairwood Dr
- 3455 Craviasco Ln
- 4841 W Hidden Valley Dr
- 5329 Mira Loma Dr
- 5279 Mira Loma Dr
- 3069 Creekwood Dr
- 5977 Hidden Highlands Dr
- 5979 Hidden Highlands Dr
- 6131 Mia Vista Dr
- 3105 Fairwood Dr
- 45 Count Fleet Ct
- 65 Count Fleet Ct
- 30 Count Fleet Ct
- 75 Count Fleet Ct
- 50 Count Fleet Ct Unit 1
- 60 Count Fleet Ct
- 25 Count Fleet Ct Unit 1
- 15 Count Fleet Ct Unit 1
- 2080 Parkway Dr
- 2110 Whirlaway Place
- 2090 Parkway Dr
- 2120 Whirlaway Place Unit 1
- 7260 Native Dancer Place
- 5 Count Fleet Ct
- 7270 Native Dancer Place Unit 1
- 2130 Whirlaway Place
- 7269 Bold Venture Ct
- 7267 Bold Venture Ct
- 7250 Native Dancer Place
- 2140 Parkway Dr