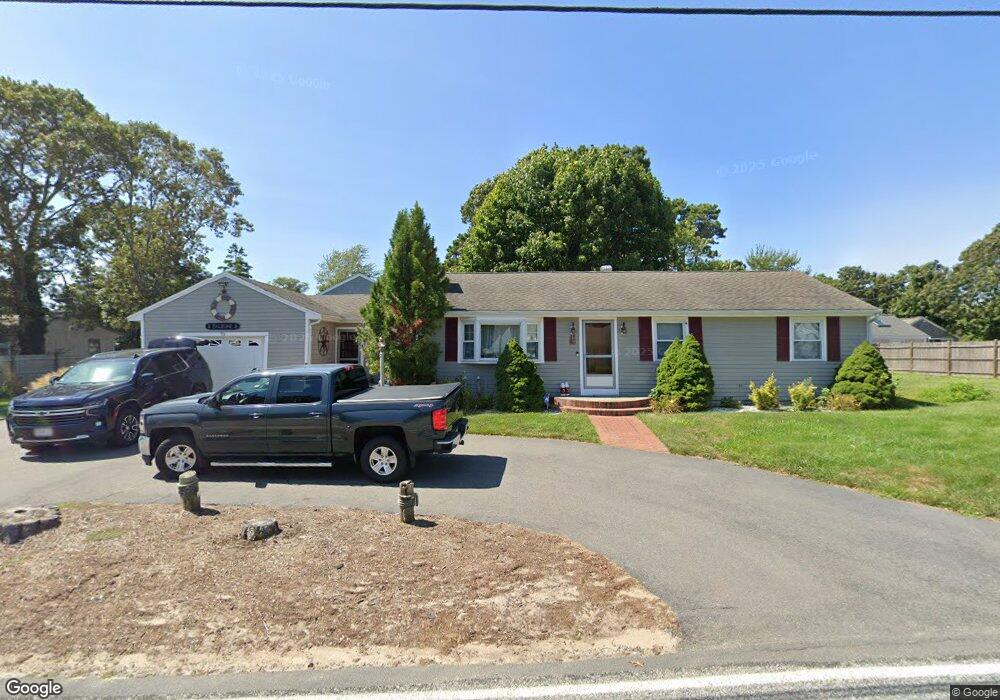
55 Depot St Dennis Port, MA 02639
Dennis Port NeighborhoodEstimated Value: $759,000 - $910,000
3
Beds
1
Bath
1,336
Sq Ft
$621/Sq Ft
Est. Value
About This Home
This home is located at 55 Depot St, Dennis Port, MA 02639 and is currently estimated at $829,914, approximately $621 per square foot. 55 Depot St is a home located in Barnstable County with nearby schools including Dennis-Yarmouth Regional High School and St. Pius X. School.
Ownership History
Date
Name
Owned For
Owner Type
Purchase Details
Closed on
Oct 9, 2009
Sold by
Oneil Robert T
Bought by
Falzone Therese M and Falzone Robert A
Current Estimated Value
Purchase Details
Closed on
Jun 30, 1997
Sold by
Est Foster Douglas M and Foster Stephen
Bought by
Oneil Robert T
Home Financials for this Owner
Home Financials are based on the most recent Mortgage that was taken out on this home.
Original Mortgage
$102,800
Interest Rate
7.81%
Mortgage Type
Purchase Money Mortgage
Purchase Details
Closed on
Jul 28, 1995
Sold by
Est Young Edwin K and Young Christine M
Bought by
Foster Douglas M
Create a Home Valuation Report for This Property
The Home Valuation Report is an in-depth analysis detailing your home's value as well as a comparison with similar homes in the area
Home Values in the Area
Average Home Value in this Area
Purchase History
| Date | Buyer | Sale Price | Title Company |
|---|---|---|---|
| Falzone Therese M | $387,500 | -- | |
| Oneil Robert T | $131,000 | -- | |
| Foster Douglas M | $140,000 | -- |
Source: Public Records
Mortgage History
| Date | Status | Borrower | Loan Amount |
|---|---|---|---|
| Previous Owner | Foster Douglas M | $25,000 | |
| Previous Owner | Foster Douglas M | $102,800 |
Source: Public Records
Tax History Compared to Growth
Tax History
| Year | Tax Paid | Tax Assessment Tax Assessment Total Assessment is a certain percentage of the fair market value that is determined by local assessors to be the total taxable value of land and additions on the property. | Land | Improvement |
|---|---|---|---|---|
| 2025 | $3,443 | $795,200 | $323,600 | $471,600 |
| 2024 | $3,296 | $750,800 | $311,200 | $439,600 |
| 2023 | $3,188 | $682,600 | $282,900 | $399,700 |
| 2022 | $2,910 | $519,700 | $223,000 | $296,700 |
| 2021 | $2,818 | $467,300 | $218,600 | $248,700 |
| 2020 | $2,711 | $444,500 | $218,600 | $225,900 |
| 2019 | $2,662 | $431,400 | $232,700 | $198,700 |
| 2018 | $2,564 | $404,400 | $221,500 | $182,900 |
| 2017 | $2,344 | $381,100 | $204,000 | $177,100 |
| 2016 | $2,244 | $343,600 | $192,400 | $151,200 |
| 2015 | $2,199 | $343,600 | $192,400 | $151,200 |
| 2014 | $2,108 | $331,900 | $180,700 | $151,200 |
Source: Public Records
Map
Nearby Homes
- 26 Manning Rd
- 11 Ocean Park W
- 12 Cross St
- 402 Old Wharf Rd
- 402 Old Wharf Rd
- 102 Sea St
- 159 Center St Unit 22
- 9 Chase Ave Unit 6
- 405 Old Wharf Rd Unit B204
- 405 Old Wharf Rd Unit B204
- 22 Ferncliff Rd
- 1 E Belmont Unit 630
- 1 Belmont Rd Unit 630
- 1 Belmont Rd Unit 513
- 73 Division St
- 37-A Beach Hills Rd
- 3 Fairbanks Dr
- 37 Beach Hills Rd
- 148 Belmont Rd
- 221 Upper County Rd Unit 2A
- 10 Kingley Rd
- 49 Depot St Unit 3
- 49 Depot St Unit 2
- 49 Depot St Unit 1
- 49 Depot St
- 63 Depot St
- 64 Depot St
- 4 Kingley Rd
- 62 Depot St
- 20 Chase St Unit B
- 20 Chase St Unit A
- 20 Chase St Unit 4
- 20 Chase St Unit 11
- 20 Chase St Unit 3
- 20 Chase St
- 70 Depot St
- 58 Depot St
- 7 Kingley Rd
- 11 Eldridge Ln
- 67 Depot St