
Seller's Agent in 2026
Kathy Morin-Paul
Kathy M. Paul Real Estate
(413) 530-0665
18 in this area
67 Total Sales
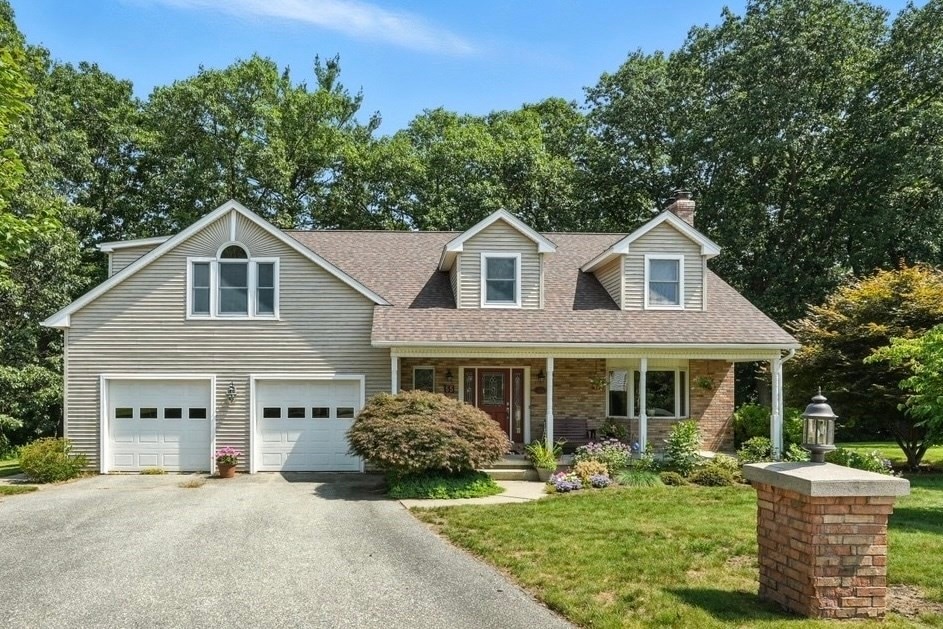


This is a very special home. You will feel it when you walk onto the front porch and thru the front door, welcoming, charming and inviting. It has a balance throughout the house that creates comfort. It's tucked away on a quiet Fairview St with beautiful Western sunset views. Oh but the house - foyer, and right to the living room, open dining room and sunroom overlooking the private back yard.The French wood slider off the sunroom opens to the very private deck. Love to cook and entertain? Well, come on in to this cook's kitchen to create and share your dinners. The quartz top island has seating and another view of the lush surroundings, cook and relax at the same time. First floor butler pantry w/sink and storage, 1st floor 3/4 bath too! Lots of closet space and storage. Upstairs? Walk up to a cozy sitting area, spacious private main suite, 2 walk in closets and private bath and huge sitting area to relax. 3 more large bedrooms and full bath. All mechanicals updated- easy living here
| Date | Type | Sale Price | Title Company |
|---|---|---|---|
| Warranty Deed | -- | None Available | |
| Deed | $185,000 | -- |
| Date | Status | Loan Amount | Loan Type |
|---|---|---|---|
| Previous Owner | $80,000 | Purchase Money Mortgage | |
| Previous Owner | $137,000 | No Value Available | |
| Previous Owner | $125,000 | No Value Available |
| Date | Event | Price | List to Sale | Price per Sq Ft |
|---|---|---|---|---|
| 02/09/2026 02/09/26 | Sold | $512,000 | -3.4% | $233 / Sq Ft |
| 01/11/2026 01/11/26 | Pending | -- | -- | -- |
| 12/26/2025 12/26/25 | Price Changed | $529,900 | -5.4% | $241 / Sq Ft |
| 10/22/2025 10/22/25 | Price Changed | $559,900 | -1.8% | $255 / Sq Ft |
| 09/11/2025 09/11/25 | For Sale | $569,900 | -- | $260 / Sq Ft |
| Year | Tax Paid | Tax Assessment Tax Assessment Total Assessment is a certain percentage of the fair market value that is determined by local assessors to be the total taxable value of land and additions on the property. | Land | Improvement |
|---|---|---|---|---|
| 2025 | $7,250 | $478,200 | $120,200 | $358,000 |
| 2024 | $6,990 | $473,600 | $117,900 | $355,700 |
| 2023 | $6,564 | $433,300 | $107,200 | $326,100 |
| 2022 | $6,495 | $382,300 | $93,100 | $289,200 |
| 2021 | $6,153 | $349,400 | $84,700 | $264,700 |
| 2020 | $5,856 | $335,400 | $87,000 | $248,400 |
| 2019 | $5,731 | $319,100 | $87,000 | $232,100 |
| 2018 | $5,498 | $300,300 | $82,900 | $217,400 |
| 2017 | $4,617 | $266,700 | $76,000 | $190,700 |
| 2016 | $4,588 | $271,300 | $76,000 | $195,300 |
| 2015 | $4,860 | $277,100 | $76,000 | $201,100 |
| 2014 | $2,430 | $277,100 | $76,000 | $201,100 |
Seller's Agent in 2026
Kathy Morin-Paul
Kathy M. Paul Real Estate
(413) 530-0665
18 in this area
67 Total Sales
L
Seller Co-Listing Agent in 2026
Lorrie Kasak Adamczyk
Kathy M. Paul Real Estate
(413) 237-5504
15 in this area
55 Total Sales
Buyer's Agent in 2026
Andrea Kennedy
Signature Realty
(413) 537-6586
2 in this area
27 Total Sales
Source: MLS Property Information Network (MLS PIN)
MLS Number: 73426678
APN: CHIC-000722-000000-000045
Disclaimer: Certain information contained herein is derived from information provided by parties other than Homes.com. All information provided is deemed reliable, but is not guaranteed to be accurate and should be independently verified.
![]() The property listing data and information, or the Images, set forth herein were provided to MLS Property Information Network, Inc. from third party sources, including sellers, lessors and public records, and were compiled by MLS Property Information Network, Inc. The property listing data and information, and the Images, are for the personal, non-commercial use of consumers having a good faith interest in purchasing or leasing listed properties of the type displayed to them and may not be used for any purpose other than to identify prospective properties which such consumers may have a good faith interest in purchasing or leasing. MLS Property Information Network, Inc. and its subscribers disclaim any and all representations and warranties as to the accuracy of the property listing data and information, or as to the accuracy of any of the Images, set forth herein.
The property listing data and information, or the Images, set forth herein were provided to MLS Property Information Network, Inc. from third party sources, including sellers, lessors and public records, and were compiled by MLS Property Information Network, Inc. The property listing data and information, and the Images, are for the personal, non-commercial use of consumers having a good faith interest in purchasing or leasing listed properties of the type displayed to them and may not be used for any purpose other than to identify prospective properties which such consumers may have a good faith interest in purchasing or leasing. MLS Property Information Network, Inc. and its subscribers disclaim any and all representations and warranties as to the accuracy of the property listing data and information, or as to the accuracy of any of the Images, set forth herein.
Ask me questions while you tour the home.